
Potential for oversold bounce limits further Flow declines

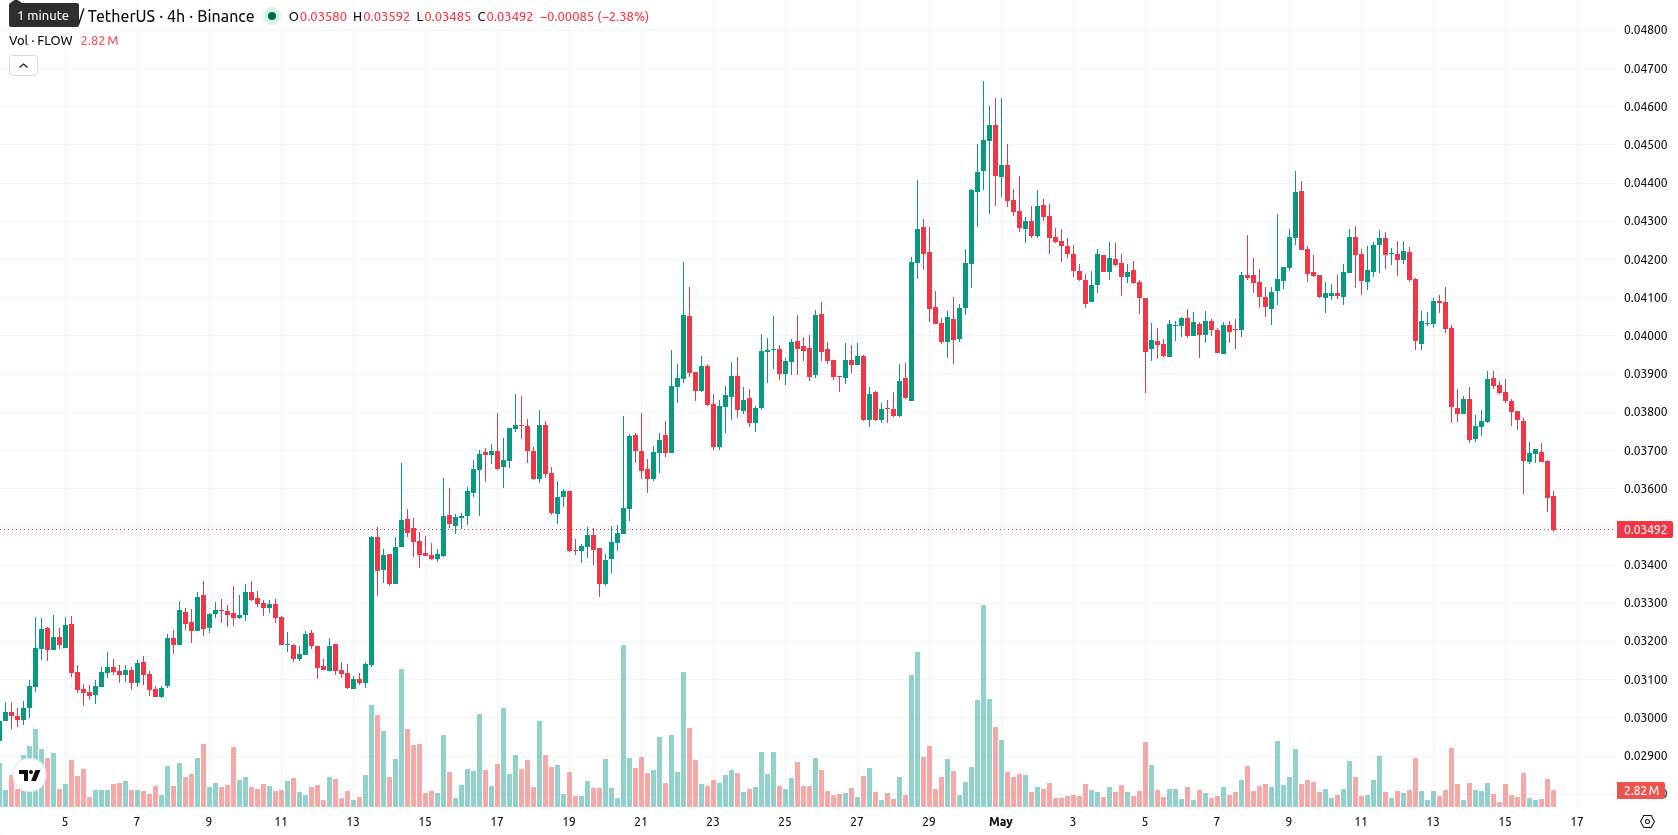
Flow (FLOW) is trading at $0.0349 after falling 7.53% on the day, marking a sharp move lower. The asset is positioned below its key moving averages, reflecting sustained downward momentum and limited recovery attempts.
Highlights
- FLOW continues to trade below major moving averages, indicating a sustained bearish trend across all timeframes.
- Momentum indicators are mixed, with MACD suggesting possible short-term upside but broader oscillator signals confirming dominant selling pressure and oversold conditions.
- Expected price action is range-bound between $0.0330 and $0.0375, with a low probability of rebound and risk of further declines if support breaks.
Unreliable rebound signals as MACD-bull divergence meets bearish momentum
The nearest resistance sits at $0.0400 (Ichimoku Kijun), with additional resistance at the SMA-20 ($0.0407), SMA-50 ($0.0363), and long-term SMA-200 ($0.1034). Short-term support is identified at today’s session low of $0.0354, with further downside risk to $0.0330. The MACD on the daily chart issues a strong buy signal, yet this is offset by moderate momentum on the ADX (22.53) and clear oversold conditions shown by RSI, BBP, and CCI, indicating that sellers remain dominant intraday. The divergence between a bullish MACD and persistent bearishness in oscillator readings highlights that any near-term rebound attempts could be unreliable as downward pressure continues.
Further declines likely as weak recovery keeps downside risks elevated
For the coming week, FLOW is expected to fluctuate within a volatility band of $0.0330 to $0.0375 around current levels. The probability of a sustained rise is very low (less than 20%) according to all weekly indicators, making further declines more likely. The baseline scenario anticipates sideways drifting within the $0.0330–$0.0375 band. A bullish scenario would require a decisive push above $0.0400, targeting $0.0375; a bearish scenario unfolds if price drops below $0.0330, where further oversold conditions could prompt an eventual attempt to stabilize.
Earlier, analysts noted that Flow was facing persistent downside risk and limited prospects for a near-term recovery amid sustained selling pressure. The latest market action confirms and amplifies this bearish outlook, with traders now advised to monitor $0.0330 as a critical support level whose breach could accelerate further declines.


Latest FLOW News


-
 Afghanistan
-
 Albania
-
 Algeria
-
 Angola
-
 Argentina
-
 Armenia
-
 Australia
-
 Austria
-
 Azerbaijan
-
 Bahamas
-
 Bahrain
-
 Bangladesh
-
 Belarus
-
 Belgium
-
 Bolivia
-
 Botswana
-
 Brazil
-
 Brunei
-
 Bulgaria
-
 Cambodia
-
 Cameroon
-
 Canada
-
 Chile
Chile
-
 China
China
-
 Colombia
-
 Congo
Congo
-
 Costa Rica
-
 Cote d'Ivoire
-
 Croatia
-
 Cuba
Cuba
-
 Cyprus
-
 Czechia
-
 DR Congo
-
 Denmark
-
 Dominican Republic
-
 Ecuador
-
 Egypt
Egypt
-
 El Salvador
-
 Estonia
-
 Eswatini
-
 Ethiopia
-
 Finland
-
 France
-
 Georgia
-
 Germany
-
 Ghana
Ghana
-
 Greece
-
 Haiti
Haiti
-
 Hong Kong
-
 Hungary
-
 India
India
-
 Indonesia
-
 Iran, Islamic republic
-
 Iraq
Iraq
-
 Ireland
-
 Israel
-
 Italy
Italy
-
 Jamaica
-
 Japan
Japan
-
 Jordan
-
 Kazakhstan
-
 Kenya
Kenya
-
 Korea
Korea
-
 Kuwait
-
 Kyrgyzstan
-
 Laos
Laos
-
 Latvia
-
 Lebanon
-
 Lesotho
-
 Libya
Libya
-
 Lithuania
-
 Luxembourg
-
 Madagascar
-
 Malaysia
-
 Malta
Malta
-
 Mauritius
-
 Mexico
-
 Moldova
-
 Mongolia
-
 Montenegro
-
 Morocco
-
 Mozambique
-
 Myanmar
-
 Namibia
-
 Nepal
Nepal
-
 Netherlands
-
 New Zealand
-
 Nigeria
-
 North Macedonia
-
 Norway
-
 Oman
Oman
-
 Pakistan
-
 Palestine
-
 Panama
-
 Papua New Guinea
-
 Paraguay
-
 Peru
Peru
-
 Philippines
-
 Poland
-
 Portugal
-
 Puerto Rico
-
 Qatar
Qatar
-
 Reunion
-
 Romania
-
 Rwanda
-
 Saudi Arabia
-
 Serbia
-
 Singapore
-
 Slovakia
-
 Slovenia
-
 Somalia
-
 South Africa
-
 Spain
Spain
-
 Sri Lanka
-
 Sweden
-
 Switzerland
-
 Syria
Syria
-
 Taiwan
-
 Tajikistan
-
 Tanzania
-
 Thailand
-
 Trinidad and Tobago
-
 Tunisia
-
 Turkey
-
 UAE
UAE
-
 Uganda
-
 Ukraine
-
 United Kingdom
-
United States
-
 Uruguay
-
 Uzbekistan
-
 Venezuela
-
 Vietnam
-
 Yemen
Yemen
-
 Zambia
-
 Zimbabwe
- Forex
- Crypto
