
QNT advances amid resistance at $83.50 holding price in current volatility: weekly review

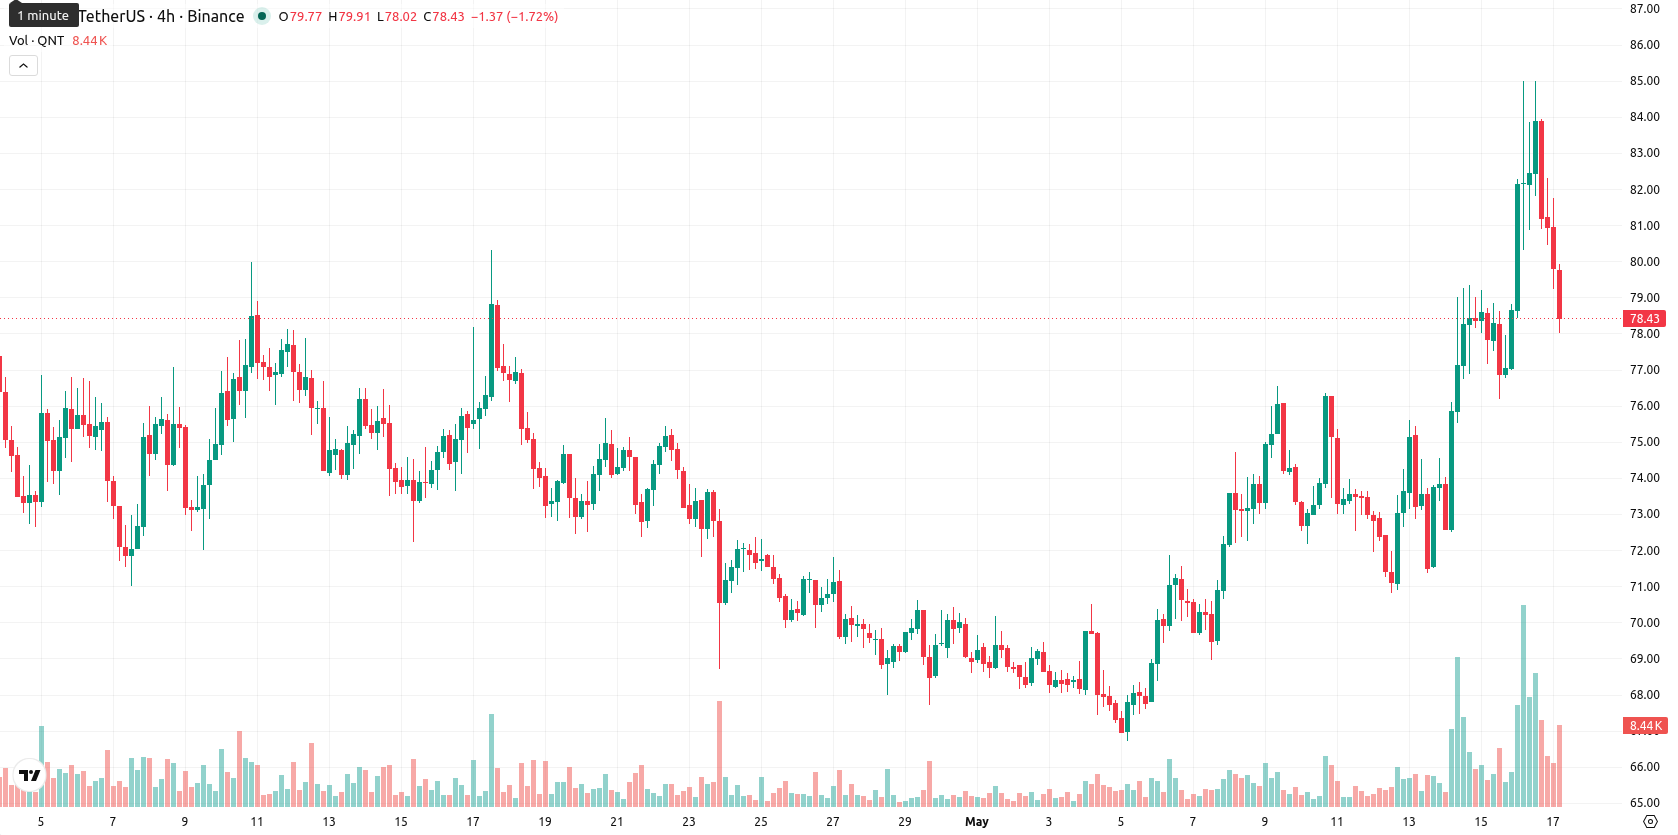
Quant (QNT) is currently trading at $78.72, registering a weekly increase of $6.49 or 8.89%. The asset has climbed above its weekly MA-20 at $71.19, but remains capped below the MA-50 at $87.38 and the MA-200 at $99.52, showing positive short-term momentum while longer-term resistance holds.
Highlights
- Quant (QNT) recently recovered 8.89% week-on-week, but remains below major medium- and long-term resistance levels.
- Momentum indicators present mixed signals, with overbought conditions and weak directional strength suggesting limited bullish follow-through.
- Baseline scenario favors rangebound trading between $75.00 and $83.50, with 75% probability of downside unless price breaks above $83.50 resistance.
Mixed technical momentum as buyers challenge persistent resistance
On the weekly timeframe, QNT displays mixed technical signals. The price sits above the weekly MA-20, indicating near-term buying activity, but continues to face resistance at the MA-50 and MA-200 levels. Weekly momentum indicators are not aligned: the MACD maintains a strong sell bias and the ADX shows weak trend strength, while the RSI points to mild buying interest. Both the Stochastic RSI and CCI reflect overbought conditions, and Bull/Bear Power remains positive. Key support is identified at $75.00, with resistance near $83.50 on the weekly chart.
Sideways bias expected as breakout risk tempers outlook
Looking ahead to the next 7 days, QNT is expected to trade within a range of $75.00 to $83.50, reflecting current weekly volatility and momentum. There is a 25% probability for further upward movement, given only one out of four key momentum indicators signals a buy. Downside risk remains more likely at 75%, with a baseline scenario of sideways price action unless a break occurs. A sustained move above $83.50 may signal a bullish breakout, whereas a drop below $75.00 would increase selling pressure and open the door to further declines.
Earlier, analysts noted that Quant (QNT) was exhibiting persistent bearish momentum, with a cautious outlook driven by weak reversal signals. The latest market action suggests short-term bullish activity amidst lingering long-term resistance, making $83.50 a crucial level to watch for any significant shift in direction.


-
 Afghanistan
-
 Albania
-
 Algeria
-
 Angola
-
 Argentina
-
 Armenia
-
 Australia
-
 Austria
-
 Azerbaijan
-
 Bahamas
-
 Bahrain
-
 Bangladesh
-
 Belarus
-
 Belgium
-
 Bolivia
-
 Botswana
-
 Brazil
-
 Brunei
-
 Bulgaria
-
 Cambodia
-
 Cameroon
-
 Canada
-
 Chile
Chile
-
 China
China
-
 Colombia
-
 Congo
Congo
-
 Costa Rica
-
 Cote d'Ivoire
-
 Croatia
-
 Cuba
Cuba
-
 Cyprus
-
 Czechia
-
 DR Congo
-
 Denmark
-
 Dominican Republic
-
 Ecuador
-
 Egypt
Egypt
-
 El Salvador
-
 Estonia
-
 Eswatini
-
 Ethiopia
-
 Finland
-
 France
-
 Georgia
-
 Germany
-
 Ghana
Ghana
-
 Greece
-
 Haiti
Haiti
-
 Hong Kong
-
 Hungary
-
 India
India
-
 Indonesia
-
 Iran, Islamic republic
-
 Iraq
Iraq
-
 Ireland
-
 Israel
-
 Italy
Italy
-
 Jamaica
-
 Japan
Japan
-
 Jordan
-
 Kazakhstan
-
 Kenya
Kenya
-
 Korea
Korea
-
 Kuwait
-
 Kyrgyzstan
-
 Laos
Laos
-
 Latvia
-
 Lebanon
-
 Lesotho
-
 Libya
Libya
-
 Lithuania
-
 Luxembourg
-
 Madagascar
-
 Malaysia
-
 Malta
Malta
-
 Mauritius
-
 Mexico
-
 Moldova
-
 Mongolia
-
 Montenegro
-
 Morocco
-
 Mozambique
-
 Myanmar
-
 Namibia
-
 Nepal
Nepal
-
 Netherlands
-
 New Zealand
-
 Nigeria
-
 North Macedonia
-
 Norway
-
 Oman
Oman
-
 Pakistan
-
 Palestine
-
 Panama
-
 Papua New Guinea
-
 Paraguay
-
 Peru
Peru
-
 Philippines
-
 Poland
-
 Portugal
-
 Puerto Rico
-
 Qatar
Qatar
-
 Reunion
-
 Romania
-
 Rwanda
-
 Saudi Arabia
-
 Serbia
-
 Singapore
-
 Slovakia
-
 Slovenia
-
 Somalia
-
 South Africa
-
 Spain
Spain
-
 Sri Lanka
-
 Sweden
-
 Switzerland
-
 Syria
Syria
-
 Taiwan
-
 Tajikistan
-
 Tanzania
-
 Thailand
-
 Trinidad and Tobago
-
 Tunisia
-
 Turkey
-
 UAE
UAE
-
 Uganda
-
 Ukraine
-
 United Kingdom
-
United States
-
 Uruguay
-
 Uzbekistan
-
 Venezuela
-
 Vietnam
-
 Yemen
Yemen
-
 Zambia
-
 Zimbabwe
- Forex
- Crypto
