
Quant hovers near $72 with MACD staying negative on the chart: weekly analysis

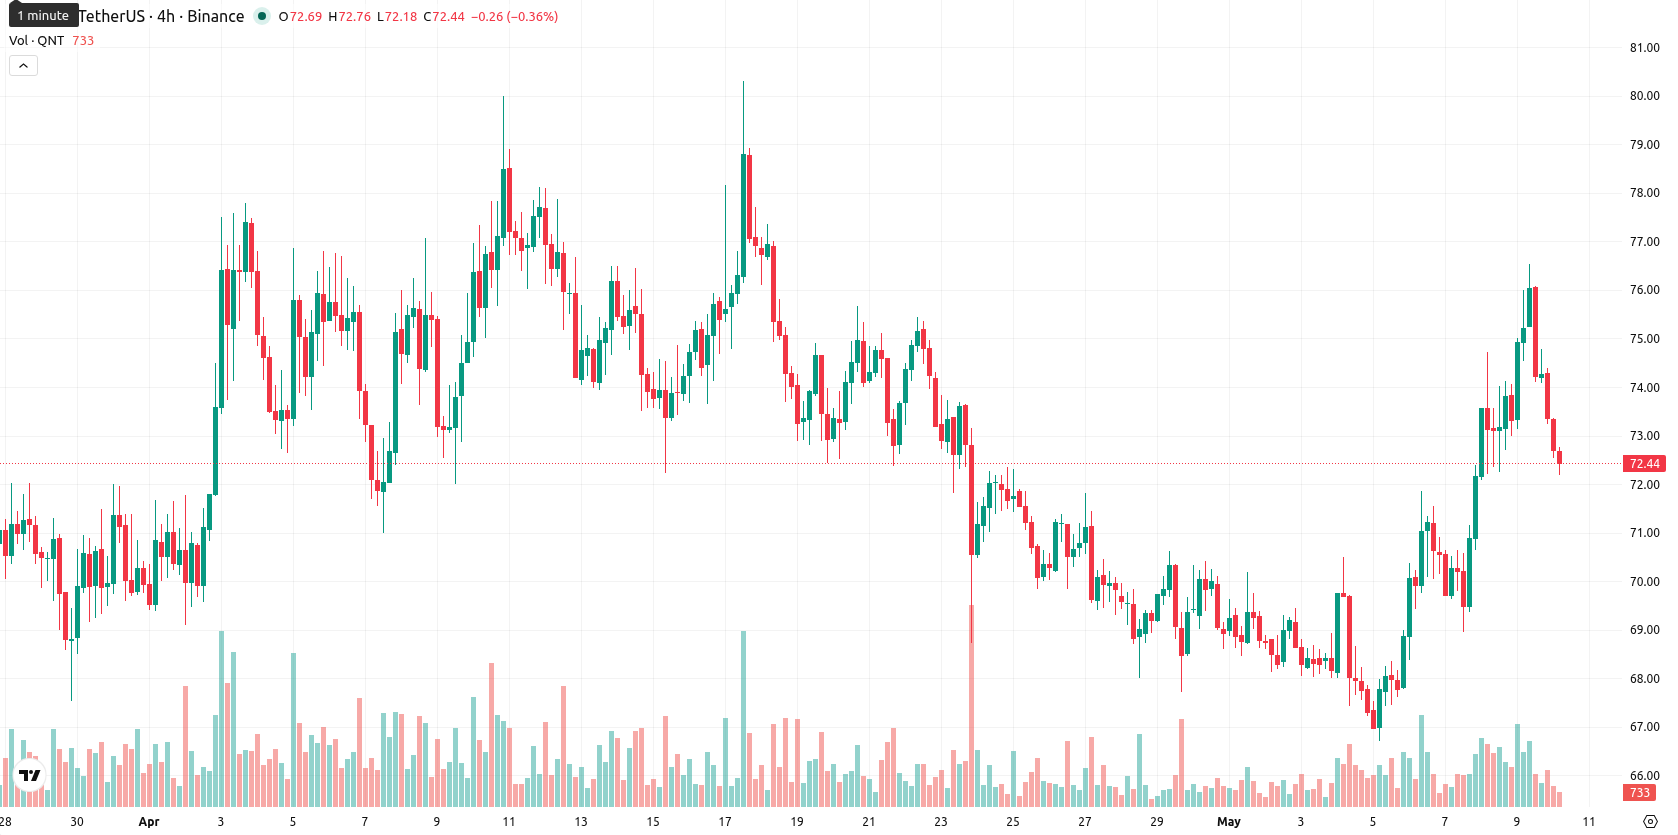
Quant (QNT) currently trades at $72.48, closing the past week with a gain of $4.09 or 5.73%. The asset is positioned slightly above its weekly MA-20 at $70.72, but remains well below both the MA-50 at $87.86 and MA-200 at $99.60, reflecting short-term stabilization, though medium- and long-term pressure persists.
Highlights
- Quant (QNT) is showing short-term stabilization but remains in a medium- and long-term bearish trend, trading below key moving averages.
- Momentum indicators are mixed, with weak trend strength and overbought signals suggesting recent buyer dominance but caution for a near-term pullback.
- Expected range for the coming week is $66.80 to $77.50, with a higher probability of downside unless $77.50 is decisively breached.
Bearish momentum persists this week with overbought signals and weak trend
On the weekly chart, QNT finds dynamic support at the MA-20 while trading in the middle of its recent range. Both the MA-50 and MA-200 sit well above the current price, reinforcing a bearish long-term technical stance. Weekly support is identified at $66.80, with resistance near $77.50. The RSI (W1) is just below the midpoint and leans bearish, while MACD stays strongly negative and ADX indicates weak trend strength; the Stochastic RSI and Bull/Bear Power signal an overbought market with potential for near-term cooldown.
Sideways consolidation likely next week amid exhaustion at resistance
In the next seven days, QNT is expected to move sideways between $66.80 and $77.50, as no key indicators currently suggest a strong buy scenario. There is less than a 20% probability of a sustained upside, and signs of exhaustion at the top increase the likelihood of a downward movement. The baseline scenario is for QNT to consolidate within this range. A break above $77.50 could trigger short-lived buying, while a slip below $66.80 may accelerate bearish momentum and test previous lows.
Earlier, analysts noted that Quant (QNT) was experiencing persistent bearish momentum, with sellers maintaining control in the absence of strong reversal signals. The latest stabilization above short-term support confirms ongoing caution, highlighting the need for traders to monitor the $66.80 level for any renewed downside risk in the coming week.


-
 Afghanistan
-
 Albania
-
 Algeria
-
 Angola
-
 Argentina
-
 Armenia
-
 Australia
-
 Austria
-
 Azerbaijan
-
 Bahamas
-
 Bahrain
-
 Bangladesh
-
 Belarus
-
 Belgium
-
 Bolivia
-
 Botswana
-
 Brazil
-
 Brunei
-
 Bulgaria
-
 Cambodia
-
 Cameroon
-
 Canada
-
 Chile
Chile
-
 China
China
-
 Colombia
-
 Congo
Congo
-
 Costa Rica
-
 Cote d'Ivoire
-
 Croatia
-
 Cuba
Cuba
-
 Cyprus
-
 Czechia
-
 DR Congo
-
 Denmark
-
 Dominican Republic
-
 Ecuador
-
 Egypt
Egypt
-
 El Salvador
-
 Estonia
-
 Eswatini
-
 Ethiopia
-
 Finland
-
 France
-
 Georgia
-
 Germany
-
 Ghana
Ghana
-
 Greece
-
 Haiti
Haiti
-
 Hong Kong
-
 Hungary
-
 India
India
-
 Indonesia
-
 Iran, Islamic republic
-
 Iraq
Iraq
-
 Ireland
-
 Israel
-
 Italy
Italy
-
 Jamaica
-
 Japan
Japan
-
 Jordan
-
 Kazakhstan
-
 Kenya
Kenya
-
 Korea
Korea
-
 Kuwait
-
 Kyrgyzstan
-
 Laos
Laos
-
 Latvia
-
 Lebanon
-
 Lesotho
-
 Libya
Libya
-
 Lithuania
-
 Luxembourg
-
 Madagascar
-
 Malaysia
-
 Malta
Malta
-
 Mauritius
-
 Mexico
-
 Moldova
-
 Mongolia
-
 Montenegro
-
 Morocco
-
 Mozambique
-
 Myanmar
-
 Namibia
-
 Nepal
Nepal
-
 Netherlands
-
 New Zealand
-
 Nigeria
-
 North Macedonia
-
 Norway
-
 Oman
Oman
-
 Pakistan
-
 Palestine
-
 Panama
-
 Papua New Guinea
-
 Paraguay
-
 Peru
Peru
-
 Philippines
-
 Poland
-
 Portugal
-
 Puerto Rico
-
 Qatar
Qatar
-
 Reunion
-
 Romania
-
 Rwanda
-
 Saudi Arabia
-
 Serbia
-
 Singapore
-
 Slovakia
-
 Slovenia
-
 Somalia
-
 South Africa
-
 Spain
Spain
-
 Sri Lanka
-
 Sweden
-
 Switzerland
-
 Syria
Syria
-
 Taiwan
-
 Tajikistan
-
 Tanzania
-
 Thailand
-
 Trinidad and Tobago
-
 Tunisia
-
 Turkey
-
 UAE
UAE
-
 Uganda
-
 Ukraine
-
 United Kingdom
-
United States
-
 Uruguay
-
 Uzbekistan
-
 Venezuela
-
 Vietnam
-
 Yemen
Yemen
-
 Zambia
-
 Zimbabwe
- Forex
- Crypto
