
Solana faces continued pressure amid dominance by sellers and elevated volatility: weekly review

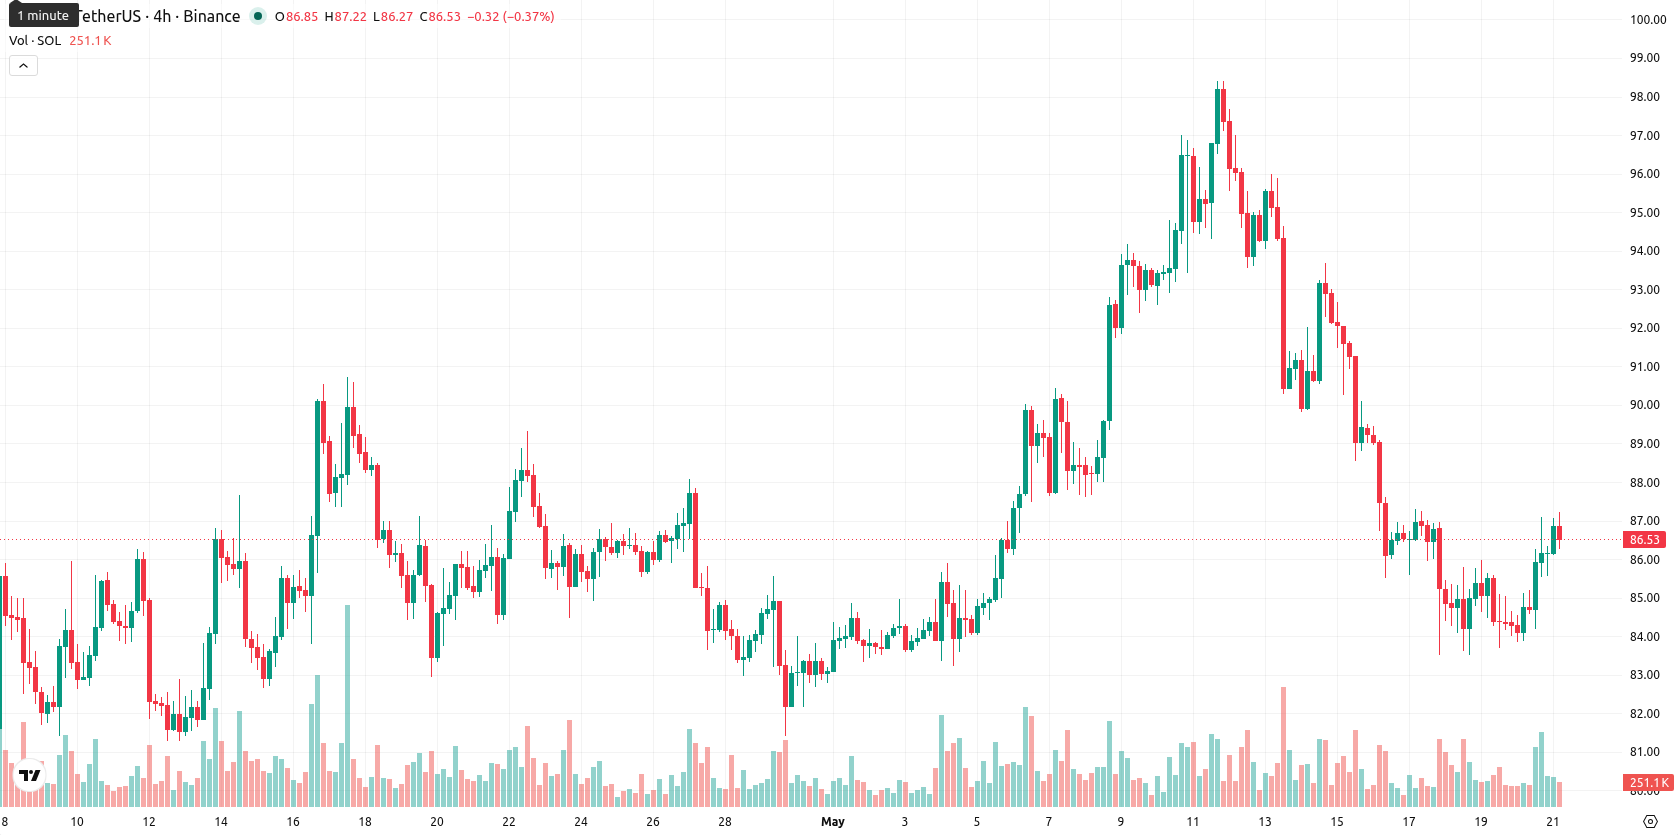
Solana (SOL) is currently trading at $86.44 after falling $4.90 (5.33%) over the past week, closing near the bottom of its weekly range. The price remains firmly below the weekly MA-20 ($93.19), MA-50 ($140.68), and MA-200 ($106.03), signaling persistent seller control and a reinforced bearish trend on the weekly timeframe.
Highlights
- Solana trades in a persistent bearish trend, pressured by seller dominance and broad weakness below key moving averages.
- Momentum and volatility indicators confirm ongoing downside risk, with little evidence of a recovery in the short term.
- SOL is expected to oscillate between $83.50 support and $92.00 resistance; a break below signals risk toward the mid-$70s.
Institutional activity accelerates this week amid persistent development and upgrades
Morgan Stanley has filed applications with the U.S. SEC to launch a spot Solana ETF, including a plan to stake SOL within the fund and to list shares under the ticker MSOL on NYSE Arca, with approval pending. Amundi, Europe's largest asset manager, introduced a UCITS-compliant fund on the Solana blockchain in partnership with Spiko Finance, underscoring growing institutional adoption. Meanwhile, stablecoin issuer Flipcash debuted USDF, a Solana-native dollar-pegged stablecoin using Coinbase’s infrastructure, as developer activity stays elevated and Alpenglow, a major network upgrade, moves forward in validator testing.
Bearish momentum prevails as indicators confirm downside over the week
On the weekly chart, SOL continues to show a bearish bias, trading well below all key moving averages: MA-20 at $93.19, MA-50 at $140.68, and MA-200 at $106.03. Weekly momentum indicators confirm the negative backdrop, as the MACD and ADX both reinforce selling strength, and the Relative Strength Index (RSI) stands at 38.84 — neither oversold nor overbought. The Stochastic RSI and Commodity Channel Index remain neutral, while Bull/Bear Power stays firmly negative, highlighting continued dominance by sellers. Volatility remains elevated at 10.97%, with the asset holding in the lower end of its weekly range between support at $83.50 and resistance near $92.00.
Sideways-to-bearish outlook expected for next week as momentum wanes
For the next 7 days, SOL is likely to oscillate sideways between $83.50 and $92.00, as weekly momentum signals do not point to a near-term recovery. Should the asset break above $92.00, upside could extend to $97.00, but the probability of such a move is low given current indicator readings. Alternatively, a drop below $83.50 would leave SOL vulnerable to further declines toward the mid-$70s if the seller strength persists. Overall, sideways-to-bearish scenarios remain favored barring a material shift in weekly technical indicators.
Earlier, analysts noted that Solana was facing persistent bearish momentum amid declining institutional inflows and regulatory headwinds. Recent developments, including new ETF filings and ongoing network upgrades, add a layer of longer-term potential, but with weekly technicals still weak, sustained seller dominance remains the prevailing scenario to monitor.


-
 Afghanistan
-
 Albania
-
 Algeria
-
 Angola
-
 Argentina
-
 Armenia
-
 Australia
-
 Austria
-
 Azerbaijan
-
 Bahamas
-
 Bahrain
-
 Bangladesh
-
 Belarus
-
 Belgium
-
 Bolivia
-
 Botswana
-
 Brazil
-
 Brunei
-
 Bulgaria
-
 Cambodia
-
 Cameroon
-
 Canada
-
 Chile
Chile
-
 China
China
-
 Colombia
-
 Congo
Congo
-
 Costa Rica
-
 Cote d'Ivoire
-
 Croatia
-
 Cuba
Cuba
-
 Cyprus
-
 Czechia
-
 DR Congo
-
 Denmark
-
 Dominican Republic
-
 Ecuador
-
 Egypt
Egypt
-
 El Salvador
-
 Estonia
-
 Eswatini
-
 Ethiopia
-
 Finland
-
 France
-
 Georgia
-
 Germany
-
 Ghana
Ghana
-
 Greece
-
 Haiti
Haiti
-
 Hong Kong
-
 Hungary
-
 India
India
-
 Indonesia
-
 Iran, Islamic republic
-
 Iraq
Iraq
-
 Ireland
-
 Israel
-
 Italy
Italy
-
 Jamaica
-
 Japan
Japan
-
 Jordan
-
 Kazakhstan
-
 Kenya
Kenya
-
 Korea
Korea
-
 Kuwait
-
 Kyrgyzstan
-
 Laos
Laos
-
 Latvia
-
 Lebanon
-
 Lesotho
-
 Libya
Libya
-
 Lithuania
-
 Luxembourg
-
 Madagascar
-
 Malaysia
-
 Malta
Malta
-
 Mauritius
-
 Mexico
-
 Moldova
-
 Mongolia
-
 Montenegro
-
 Morocco
-
 Mozambique
-
 Myanmar
-
 Namibia
-
 Nepal
Nepal
-
 Netherlands
-
 New Zealand
-
 Nigeria
-
 North Macedonia
-
 Norway
-
 Oman
Oman
-
 Pakistan
-
 Palestine
-
 Panama
-
 Papua New Guinea
-
 Paraguay
-
 Peru
Peru
-
 Philippines
-
 Poland
-
 Portugal
-
 Puerto Rico
-
 Qatar
Qatar
-
 Reunion
-
 Romania
-
 Rwanda
-
 Saudi Arabia
-
 Serbia
-
 Singapore
-
 Slovakia
-
 Slovenia
-
 Somalia
-
 South Africa
-
 Spain
Spain
-
 Sri Lanka
-
 Sweden
-
 Switzerland
-
 Syria
Syria
-
 Taiwan
-
 Tajikistan
-
 Tanzania
-
 Thailand
-
 Trinidad and Tobago
-
 Tunisia
-
 Turkey
-
 UAE
UAE
-
 Uganda
-
 Ukraine
-
 United Kingdom
-
United States
-
 Uruguay
-
 Uzbekistan
-
 Venezuela
-
 Vietnam
-
 Yemen
Yemen
-
 Zambia
-
 Zimbabwe
- Forex
- Crypto
