
ETC edges lower facing resistance at the MA-20: weekly report

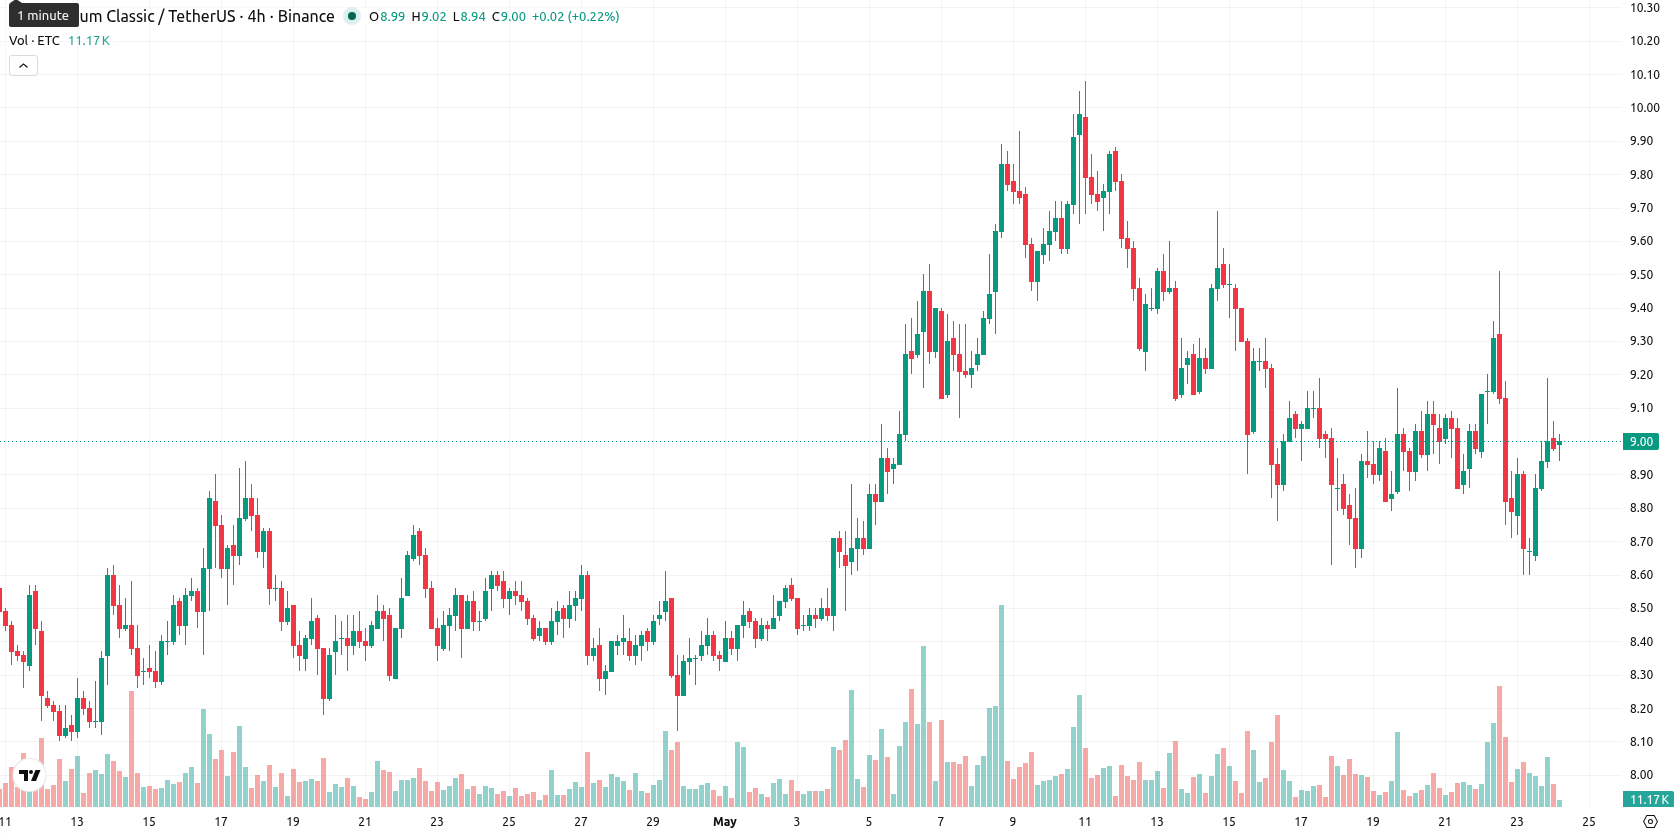
Ethereum Classic (ETC) is trading at $8.99, registering a weekly decline of $0.09, or 1.10%. The asset sits just below its weekly MA-20 at $9.0975, and remains well under the MA-50 at $14.1866 and MA-200 at $20.25905, indicating continued medium- and long-term selling pressure and consolidation beneath resistance.
Highlights
- Ethereum Classic trades below all major moving averages, confirming sustained medium- and long-term bearish pressure.
- Momentum indicators remain negative with no clear buy signals, while a modest weekly decline signals ongoing consolidation.
- Expected range for the next week is $8.81 to $9.11, with downside risk dominating unless $9.11 is convincingly breached.
Bearish technical momentum dominates despite neutral secondary signals this week
On the weekly (W1) timeframe, technical momentum for ETC remains negative. The MACD signals 'Strong Sell' and the ADX registers as 'Sell', both pointing to prevailing bearish sentiment. The RSI stands at 40.62, which is moderately weak but not oversold, while the Stochastic RSI is neutral at an elevated value and the CCI reads neutral as well. Bull/Bear Power reflects some buyer bias, though it contrasts with the overall lack of bullish momentum. ETC is currently trading in the $8.60 to $9.51 weekly range, with volatility at 10.58%, suggesting a consolidative but fragile outlook.
Sideways bias persists as breakout risk remains subdued for next week
Looking forward over the next seven days, ETC is expected to move within a range of $8.81 to $9.11. With none of the four key W1 indicators in Buy or Strong Buy territory, there is less than a 20% chance of an upside breakout. The base case points to continued sideways trading between recent support and resistance levels. A push above $9.11 would signal initial bullish intent, though this scenario is unlikely with current momentum, while a breakdown below $8.81 would reinforce downside risk and open room for further declines.
Earlier, analysts noted that Ethereum Classic faced sustained bearish momentum and was at risk of further downside as sellers dominated. This outlook remains intact, with persistent bearish signals suggesting traders should closely monitor the $8.81 support level for any signs of renewed weakness in the week ahead.


Latest Ethereum Classic (ETC) News


-
 Afghanistan
-
 Albania
-
 Algeria
-
 Angola
-
 Argentina
-
 Armenia
-
 Australia
-
 Austria
-
 Azerbaijan
-
 Bahamas
-
 Bahrain
-
 Bangladesh
-
 Belarus
-
 Belgium
-
 Bolivia
-
 Botswana
-
 Brazil
-
 Brunei
-
 Bulgaria
-
 Cambodia
-
 Cameroon
-
 Canada
-
 Chile
Chile
-
 China
China
-
 Colombia
-
 Congo
Congo
-
 Costa Rica
-
 Cote d'Ivoire
-
 Croatia
-
 Cuba
Cuba
-
 Cyprus
-
 Czechia
-
 DR Congo
-
 Denmark
-
 Dominican Republic
-
 Ecuador
-
 Egypt
Egypt
-
 El Salvador
-
 Estonia
-
 Eswatini
-
 Ethiopia
-
 Finland
-
 France
-
 Georgia
-
 Germany
-
 Ghana
Ghana
-
 Greece
-
 Haiti
Haiti
-
 Hong Kong
-
 Hungary
-
 India
India
-
 Indonesia
-
 Iran, Islamic republic
-
 Iraq
Iraq
-
 Ireland
-
 Israel
-
 Italy
Italy
-
 Jamaica
-
 Japan
Japan
-
 Jordan
-
 Kazakhstan
-
 Kenya
Kenya
-
 Korea
Korea
-
 Kuwait
-
 Kyrgyzstan
-
 Laos
Laos
-
 Latvia
-
 Lebanon
-
 Lesotho
-
 Libya
Libya
-
 Lithuania
-
 Luxembourg
-
 Madagascar
-
 Malaysia
-
 Malta
Malta
-
 Mauritius
-
 Mexico
-
 Moldova
-
 Mongolia
-
 Montenegro
-
 Morocco
-
 Mozambique
-
 Myanmar
-
 Namibia
-
 Nepal
Nepal
-
 Netherlands
-
 New Zealand
-
 Nigeria
-
 North Macedonia
-
 Norway
-
 Oman
Oman
-
 Pakistan
-
 Palestine
-
 Panama
-
 Papua New Guinea
-
 Paraguay
-
 Peru
Peru
-
 Philippines
-
 Poland
-
 Portugal
-
 Puerto Rico
-
 Qatar
Qatar
-
 Reunion
-
 Romania
-
 Rwanda
-
 Saudi Arabia
-
 Serbia
-
 Singapore
-
 Slovakia
-
 Slovenia
-
 Somalia
-
 South Africa
-
 Spain
Spain
-
 Sri Lanka
-
 Sweden
-
 Switzerland
-
 Syria
Syria
-
 Taiwan
-
 Tajikistan
-
 Tanzania
-
 Thailand
-
 Trinidad and Tobago
-
 Tunisia
-
 Turkey
-
 UAE
UAE
-
 Uganda
-
 Ukraine
-
 United Kingdom
-
United States
-
 Uruguay
-
 Uzbekistan
-
 Venezuela
-
 Vietnam
-
 Yemen
Yemen
-
 Zambia
-
 Zimbabwe
- Forex
- Crypto
