
Quant climbs 7.81% as intraday buyers keep price near session highs

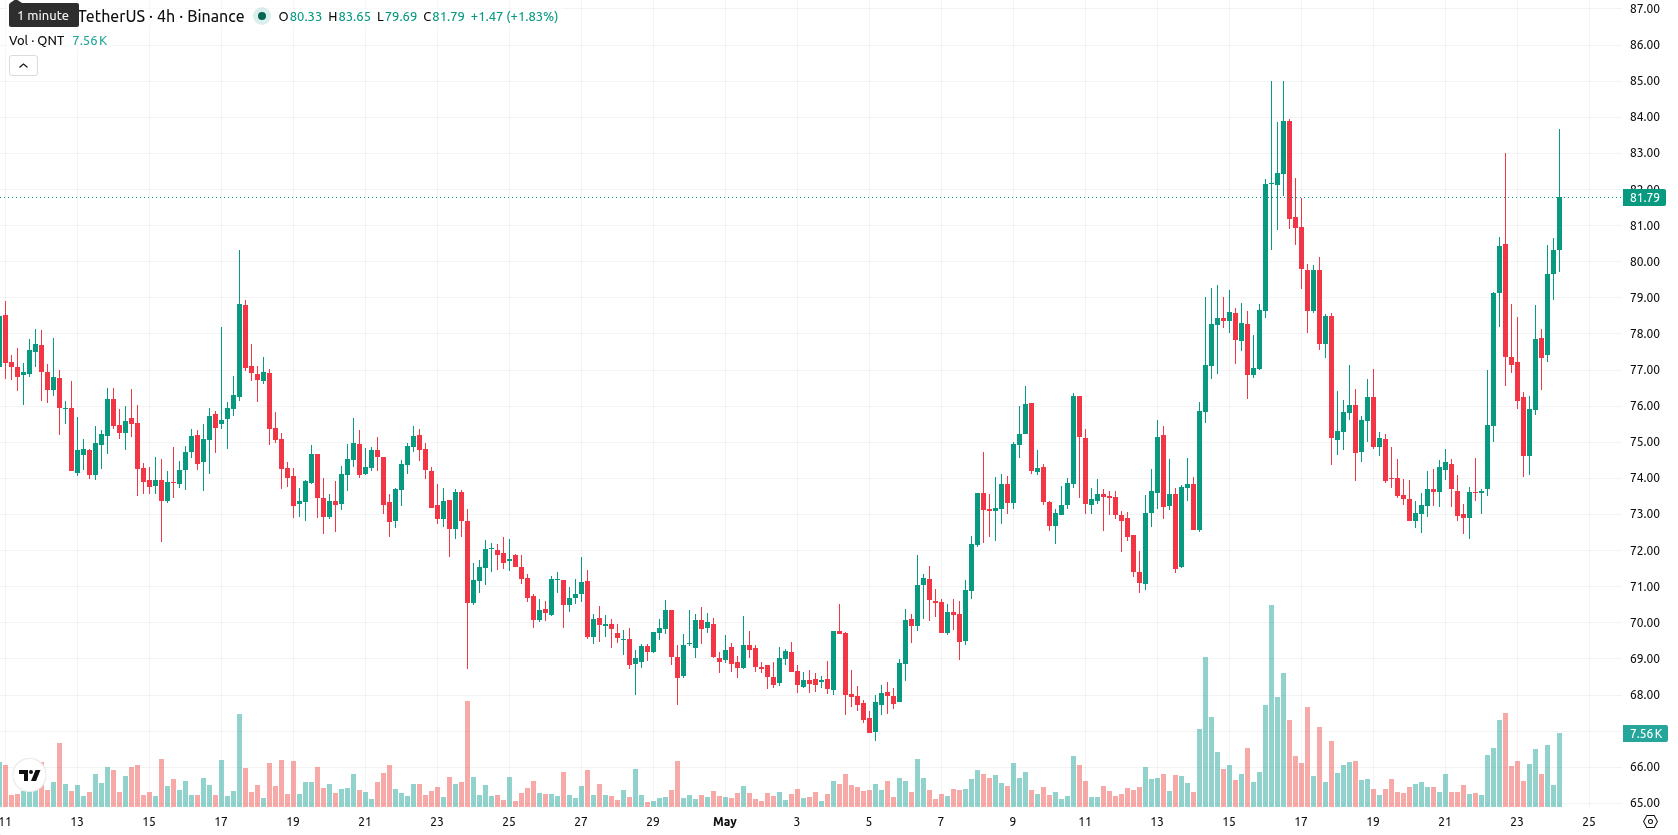
Quant (QNT) is trading at $82.12, rising 7.81% on the day and maintaining a position well above its key moving averages. This action reflects significant short-term momentum and marks a notable session high relative to recent averages.
Highlights
- QNT trades in a bullish structure above major moving averages, with daily momentum remaining positive but not extreme.
- A broad forecasted trading range of $76.00 to $88.00 is expected over the next five sessions amid high volatility.
- Probability of upside is below 20%, with bearish weekly indicators suggesting consolidation or downside risk dominates in the near term.
Strong buyer dominance as indicators signal overbought volatility
QNT currently trades above the MA-20 ($74.39), MA-50 ($73.54), and MA-200 ($74.70), with immediate support at the Ichimoku Kijun level of $75.85. The daily MACD signals buy, while the ADX remains neutral, reflecting moderate trend strength. The RSI at 60 and CCI at 80 confirm supportive momentum just below technical overbought thresholds, whereas Stoch RSI is neutral and AO shows no conviction. Bull/Bear Power (BBP) indicates pronounced buyer dominance intraday, signaling a strongly overbought zone and possible short-term fatigue. Today’s trading session opened higher ($79.66 vs. $76.17 previous close), and price activity remains near session highs, denoting high volatility.
Downside risk increases as breakout odds diminish
Over the next five trading days, QNT is projected to move within a $76.00 to $88.00 volatility band relative to current levels. The likelihood of a further upward breakout is very low (below 20%), suggesting a higher probability of downward movement due to persistent weekly-period bearish signals in the MACD and long-term moving averages. The baseline scenario is for continued consolidation between $76 and $88, matching recent wide market swings. A clear break above $88 could trigger renewed buying, whereas a fall below $76 would likely increase downside momentum and open the way for further retracement.
Earlier, analysts noted that Quant was demonstrating renewed bullish momentum but with conflicting signals from technical indicators, casting uncertainty over the sustainability of its rally. The current price action not only sustains this positive momentum but also highlights increasing intraday volatility, making the $76 to $88 consolidation range especially important for traders to monitor in the coming days.


-
 Afghanistan
-
 Albania
-
 Algeria
-
 Angola
-
 Argentina
-
 Armenia
-
 Australia
-
 Austria
-
 Azerbaijan
-
 Bahamas
-
 Bahrain
-
 Bangladesh
-
 Belarus
-
 Belgium
-
 Bolivia
-
 Botswana
-
 Brazil
-
 Brunei
-
 Bulgaria
-
 Cambodia
-
 Cameroon
-
 Canada
-
 Chile
Chile
-
 China
China
-
 Colombia
-
 Congo
Congo
-
 Costa Rica
-
 Cote d'Ivoire
-
 Croatia
-
 Cuba
Cuba
-
 Cyprus
-
 Czechia
-
 DR Congo
-
 Denmark
-
 Dominican Republic
-
 Ecuador
-
 Egypt
Egypt
-
 El Salvador
-
 Estonia
-
 Eswatini
-
 Ethiopia
-
 Finland
-
 France
-
 Georgia
-
 Germany
-
 Ghana
Ghana
-
 Greece
-
 Haiti
Haiti
-
 Hong Kong
-
 Hungary
-
 India
India
-
 Indonesia
-
 Iran, Islamic republic
-
 Iraq
Iraq
-
 Ireland
-
 Israel
-
 Italy
Italy
-
 Jamaica
-
 Japan
Japan
-
 Jordan
-
 Kazakhstan
-
 Kenya
Kenya
-
 Korea
Korea
-
 Kuwait
-
 Kyrgyzstan
-
 Laos
Laos
-
 Latvia
-
 Lebanon
-
 Lesotho
-
 Libya
Libya
-
 Lithuania
-
 Luxembourg
-
 Madagascar
-
 Malaysia
-
 Malta
Malta
-
 Mauritius
-
 Mexico
-
 Moldova
-
 Mongolia
-
 Montenegro
-
 Morocco
-
 Mozambique
-
 Myanmar
-
 Namibia
-
 Nepal
Nepal
-
 Netherlands
-
 New Zealand
-
 Nigeria
-
 North Macedonia
-
 Norway
-
 Oman
Oman
-
 Pakistan
-
 Palestine
-
 Panama
-
 Papua New Guinea
-
 Paraguay
-
 Peru
Peru
-
 Philippines
-
 Poland
-
 Portugal
-
 Puerto Rico
-
 Qatar
Qatar
-
 Reunion
-
 Romania
-
 Rwanda
-
 Saudi Arabia
-
 Serbia
-
 Singapore
-
 Slovakia
-
 Slovenia
-
 Somalia
-
 South Africa
-
 Spain
Spain
-
 Sri Lanka
-
 Sweden
-
 Switzerland
-
 Syria
Syria
-
 Taiwan
-
 Tajikistan
-
 Tanzania
-
 Thailand
-
 Trinidad and Tobago
-
 Tunisia
-
 Turkey
-
 UAE
UAE
-
 Uganda
-
 Ukraine
-
 United Kingdom
-
United States
-
 Uruguay
-
 Uzbekistan
-
 Venezuela
-
 Vietnam
-
 Yemen
Yemen
-
 Zambia
-
 Zimbabwe
- Forex
- Crypto
