
QNT trades in recent range amid overbought RSI signals: weekly report

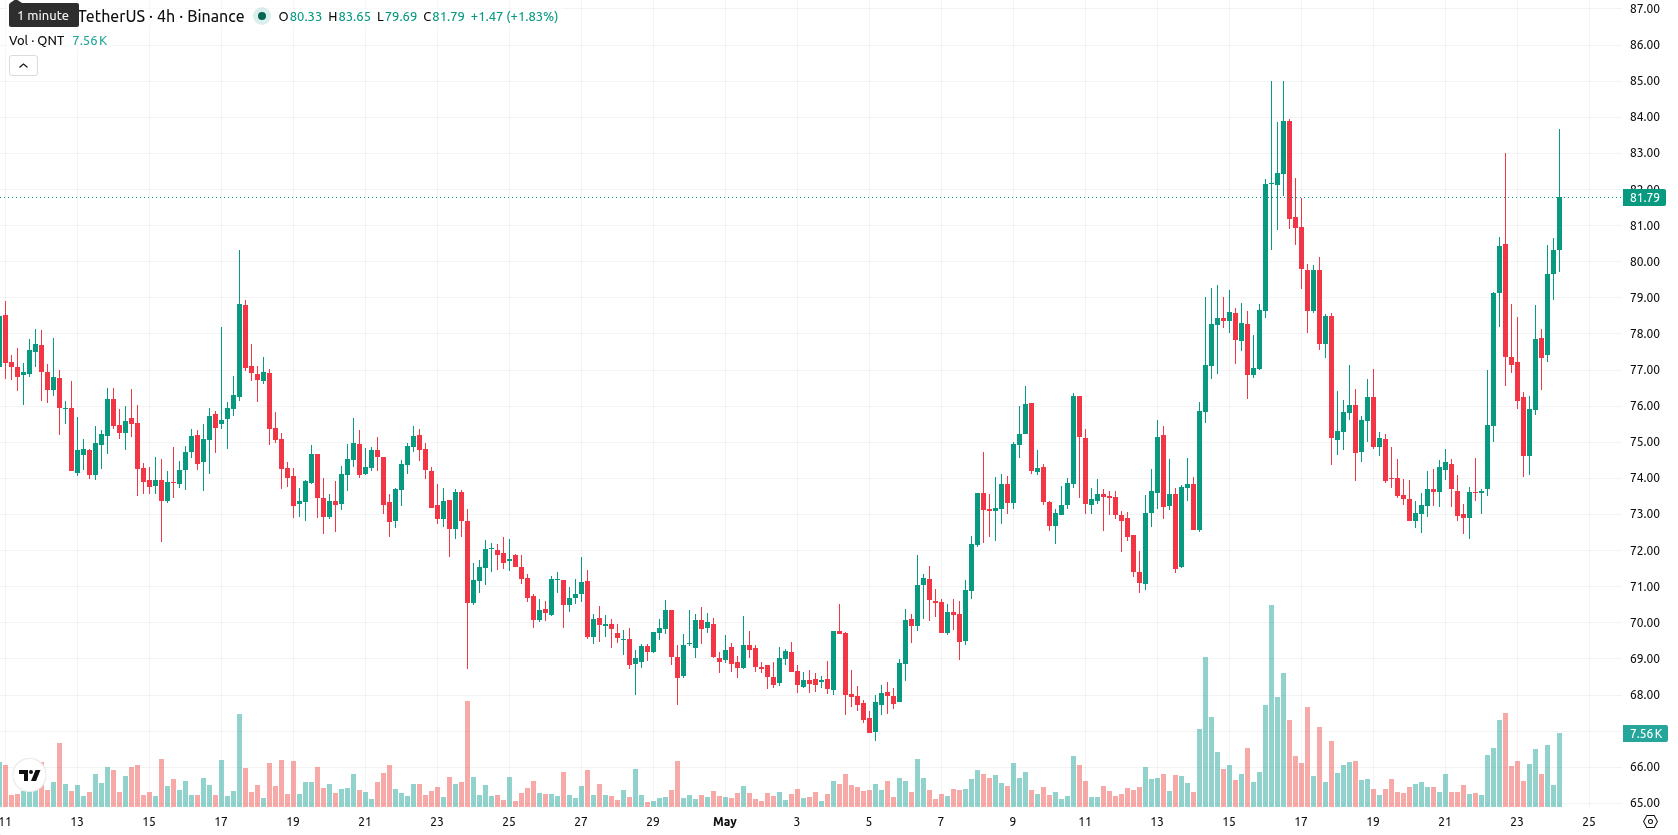
Quant (QNT) is trading at $81.94, which marks a $3.65 increase (4.87%) over the past week. The asset is positioned above the weekly MA-20 ($70.90), indicating positive momentum in the medium term, but remains below both the MA-50 ($86.44) and MA-200 ($99.39), reflecting persistent selling pressure in the longer term.
Highlights
- Quant (QNT) trades near the top of its weekly range following a strong 4.87% rally on heightened volatility.
- Momentum indicators are mixed with overbought signals and weak trend strength, showing a divergence from the recent price surge.
- The forecast for QNT is consolidation between $76.50 and $87.50 over the next week, with equally balanced upside and downside risks.
Mixed overbought signals as price consolidates below dynamic resistance
On the weekly chart, QNT shows mixed technical signals. The price is consolidating above the MA-20 but struggling to reclaim the MA-50 and MA-200, with the MA-50 acting as a dynamic resistance. Weekly momentum indicators are divided: MACD remains firmly bearish and ADX is neutral, suggesting the broader trend is subdued. However, RSI, CCI, Bull/Bear Power, and Stochastic RSI all signal an overbought market with a dominance of buyers, while volatility spikes to 14.75%. Key weekly support stands at $76.50, and resistance is found near $87.50.
Sideways outlook as volatility and indicator balance shape next week
Looking ahead to the next 7 days, QNT is likely to trade within a corridor of $76.50 to $87.50, in line with recent volatility and consolidative behavior around current levels. With two out of four key weekly indicators in Buy or Strong Buy territory, the market faces a balanced outlook, and there is a roughly equal probability of price increase or pullback. The base scenario calls for sideways consolidation, but a push above resistance could spark further upside toward $87.50, whereas fading momentum would see the price retreat toward $76.50 support.
Earlier, analysts noted that Quant was exhibiting strong short-term momentum but with mixed technical signals, casting uncertainty over the sustainability of its rally. The current outlook reinforces this cautious stance, emphasizing that traders should watch for a breakout above $87.50 resistance or a retreat below $76.50 support as cues for the next decisive move.


-
 Afghanistan
-
 Albania
-
 Algeria
-
 Angola
-
 Argentina
-
 Armenia
-
 Australia
-
 Austria
-
 Azerbaijan
-
 Bahamas
-
 Bahrain
-
 Bangladesh
-
 Belarus
-
 Belgium
-
 Bolivia
-
 Botswana
-
 Brazil
-
 Brunei
-
 Bulgaria
-
 Cambodia
-
 Cameroon
-
 Canada
-
 Chile
Chile
-
 China
China
-
 Colombia
-
 Congo
Congo
-
 Costa Rica
-
 Cote d'Ivoire
-
 Croatia
-
 Cuba
Cuba
-
 Cyprus
-
 Czechia
-
 DR Congo
-
 Denmark
-
 Dominican Republic
-
 Ecuador
-
 Egypt
Egypt
-
 El Salvador
-
 Estonia
-
 Eswatini
-
 Ethiopia
-
 Finland
-
 France
-
 Georgia
-
 Germany
-
 Ghana
Ghana
-
 Greece
-
 Haiti
Haiti
-
 Hong Kong
-
 Hungary
-
 India
India
-
 Indonesia
-
 Iran, Islamic republic
-
 Iraq
Iraq
-
 Ireland
-
 Israel
-
 Italy
Italy
-
 Jamaica
-
 Japan
Japan
-
 Jordan
-
 Kazakhstan
-
 Kenya
Kenya
-
 Korea
Korea
-
 Kuwait
-
 Kyrgyzstan
-
 Laos
Laos
-
 Latvia
-
 Lebanon
-
 Lesotho
-
 Libya
Libya
-
 Lithuania
-
 Luxembourg
-
 Madagascar
-
 Malaysia
-
 Malta
Malta
-
 Mauritius
-
 Mexico
-
 Moldova
-
 Mongolia
-
 Montenegro
-
 Morocco
-
 Mozambique
-
 Myanmar
-
 Namibia
-
 Nepal
Nepal
-
 Netherlands
-
 New Zealand
-
 Nigeria
-
 North Macedonia
-
 Norway
-
 Oman
Oman
-
 Pakistan
-
 Palestine
-
 Panama
-
 Papua New Guinea
-
 Paraguay
-
 Peru
Peru
-
 Philippines
-
 Poland
-
 Portugal
-
 Puerto Rico
-
 Qatar
Qatar
-
 Reunion
-
 Romania
-
 Rwanda
-
 Saudi Arabia
-
 Serbia
-
 Singapore
-
 Slovakia
-
 Slovenia
-
 Somalia
-
 South Africa
-
 Spain
Spain
-
 Sri Lanka
-
 Sweden
-
 Switzerland
-
 Syria
Syria
-
 Taiwan
-
 Tajikistan
-
 Tanzania
-
 Thailand
-
 Trinidad and Tobago
-
 Tunisia
-
 Turkey
-
 UAE
UAE
-
 Uganda
-
 Ukraine
-
 United Kingdom
-
United States
-
 Uruguay
-
 Uzbekistan
-
 Venezuela
-
 Vietnam
-
 Yemen
Yemen
-
 Zambia
-
 Zimbabwe
- Forex
- Crypto
