
Dash gains with RSI highlighting buyer strength: weekly outlook

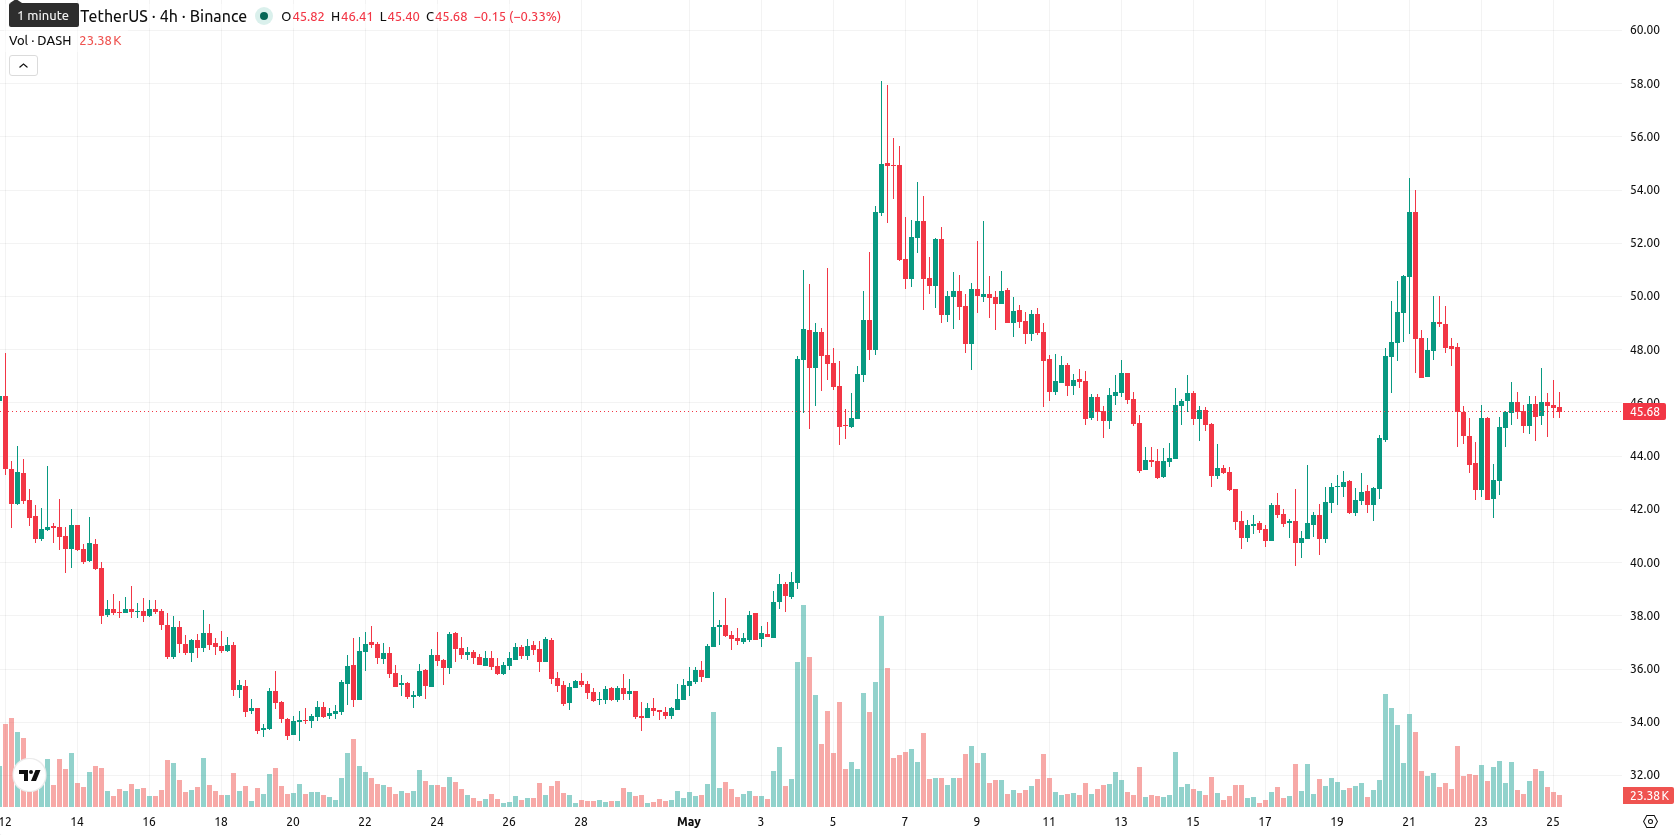
Dash (DASH) gained $4.05 (9.84%) over the last week, finishing in the lower part of its seven-day range after notable volatility of 30.94%. The price remains above the weekly MA-20 ($40.08), MA-50 ($38.35), and MA-200 ($35.89), suggesting a continuation of medium- and long-term bullish momentum, although it still trades below the Ichimoku Kijun ($63.08).
Highlights
- Dash maintains medium- and long-term bullish momentum, trading above key moving averages on the weekly chart.
- Momentum is firm with bullish signals; short-term caution is warranted as overbought indicators emerge amid recent volatility.
- The 7-day price range is projected between $41.24 and $50.40, with an equal likelihood of breakout or pullback.
Mixed overbought signals emerge as bullish momentum holds through week
On the weekly chart, Dash maintains strong bullish momentum above its MA-20, MA-50, and MA-200 lines, with dynamic support established near the MA-20. The Ichimoku Kijun provides overhead resistance at $63.08. Weekly indicators remain mixed: ADX signals a clear directional trend, MACD is neutral, RSI shows buyer strength, and both Stochastic RSI and Bull/Bear Power point to overbought conditions, highlighting buyer dominance but raising some caution.
Sideways range expected as volatility shapes breakout risks next week
Given current W1 indicator readings and prevailing volatility, Dash is expected to trade between $41.24 and $50.40 over the next 7 days. The baseline scenario is for sideways movement within this range. Should bullish momentum strengthen, a breakout above $50.40 would bring higher resistance into focus, while a bearish move below $41.24 could trigger a deeper decline toward the weekly moving averages.
Earlier, analysts noted that Dash was exhibiting strong bullish momentum but faced potential for sideways consolidation amid conflicting technical signals. The current technical setup continues to underline prevailing bullish pressure, making a decisive move above $50.40 the key trigger to watch for near-term upside acceleration.


-
 Afghanistan
-
 Albania
-
 Algeria
-
 Angola
-
 Argentina
-
 Armenia
-
 Australia
-
 Austria
-
 Azerbaijan
-
 Bahamas
-
 Bahrain
-
 Bangladesh
-
 Belarus
-
 Belgium
-
 Bolivia
-
 Botswana
-
 Brazil
-
 Brunei
-
 Bulgaria
-
 Cambodia
-
 Cameroon
-
 Canada
-
 Chile
Chile
-
 China
China
-
 Colombia
-
 Congo
Congo
-
 Costa Rica
-
 Cote d'Ivoire
-
 Croatia
-
 Cuba
Cuba
-
 Cyprus
-
 Czechia
-
 DR Congo
-
 Denmark
-
 Dominican Republic
-
 Ecuador
-
 Egypt
Egypt
-
 El Salvador
-
 Estonia
-
 Eswatini
-
 Ethiopia
-
 Finland
-
 France
-
 Georgia
-
 Germany
-
 Ghana
Ghana
-
 Greece
-
 Haiti
Haiti
-
 Hong Kong
-
 Hungary
-
 India
India
-
 Indonesia
-
 Iran, Islamic republic
-
 Iraq
Iraq
-
 Ireland
-
 Israel
-
 Italy
Italy
-
 Jamaica
-
 Japan
Japan
-
 Jordan
-
 Kazakhstan
-
 Kenya
Kenya
-
 Korea
Korea
-
 Kuwait
-
 Kyrgyzstan
-
 Laos
Laos
-
 Latvia
-
 Lebanon
-
 Lesotho
-
 Libya
Libya
-
 Lithuania
-
 Luxembourg
-
 Madagascar
-
 Malaysia
-
 Malta
Malta
-
 Mauritius
-
 Mexico
-
 Moldova
-
 Mongolia
-
 Montenegro
-
 Morocco
-
 Mozambique
-
 Myanmar
-
 Namibia
-
 Nepal
Nepal
-
 Netherlands
-
 New Zealand
-
 Nigeria
-
 North Macedonia
-
 Norway
-
 Oman
Oman
-
 Pakistan
-
 Palestine
-
 Panama
-
 Papua New Guinea
-
 Paraguay
-
 Peru
Peru
-
 Philippines
-
 Poland
-
 Portugal
-
 Puerto Rico
-
 Qatar
Qatar
-
 Reunion
-
 Romania
-
 Rwanda
-
 Saudi Arabia
-
 Serbia
-
 Singapore
-
 Slovakia
-
 Slovenia
-
 Somalia
-
 South Africa
-
 Spain
Spain
-
 Sri Lanka
-
 Sweden
-
 Switzerland
-
 Syria
Syria
-
 Taiwan
-
 Tajikistan
-
 Tanzania
-
 Thailand
-
 Trinidad and Tobago
-
 Tunisia
-
 Turkey
-
 UAE
UAE
-
 Uganda
-
 Ukraine
-
 United Kingdom
-
United States
-
 Uruguay
-
 Uzbekistan
-
 Venezuela
-
 Vietnam
-
 Yemen
Yemen
-
 Zambia
-
 Zimbabwe
- Forex
- Crypto
