
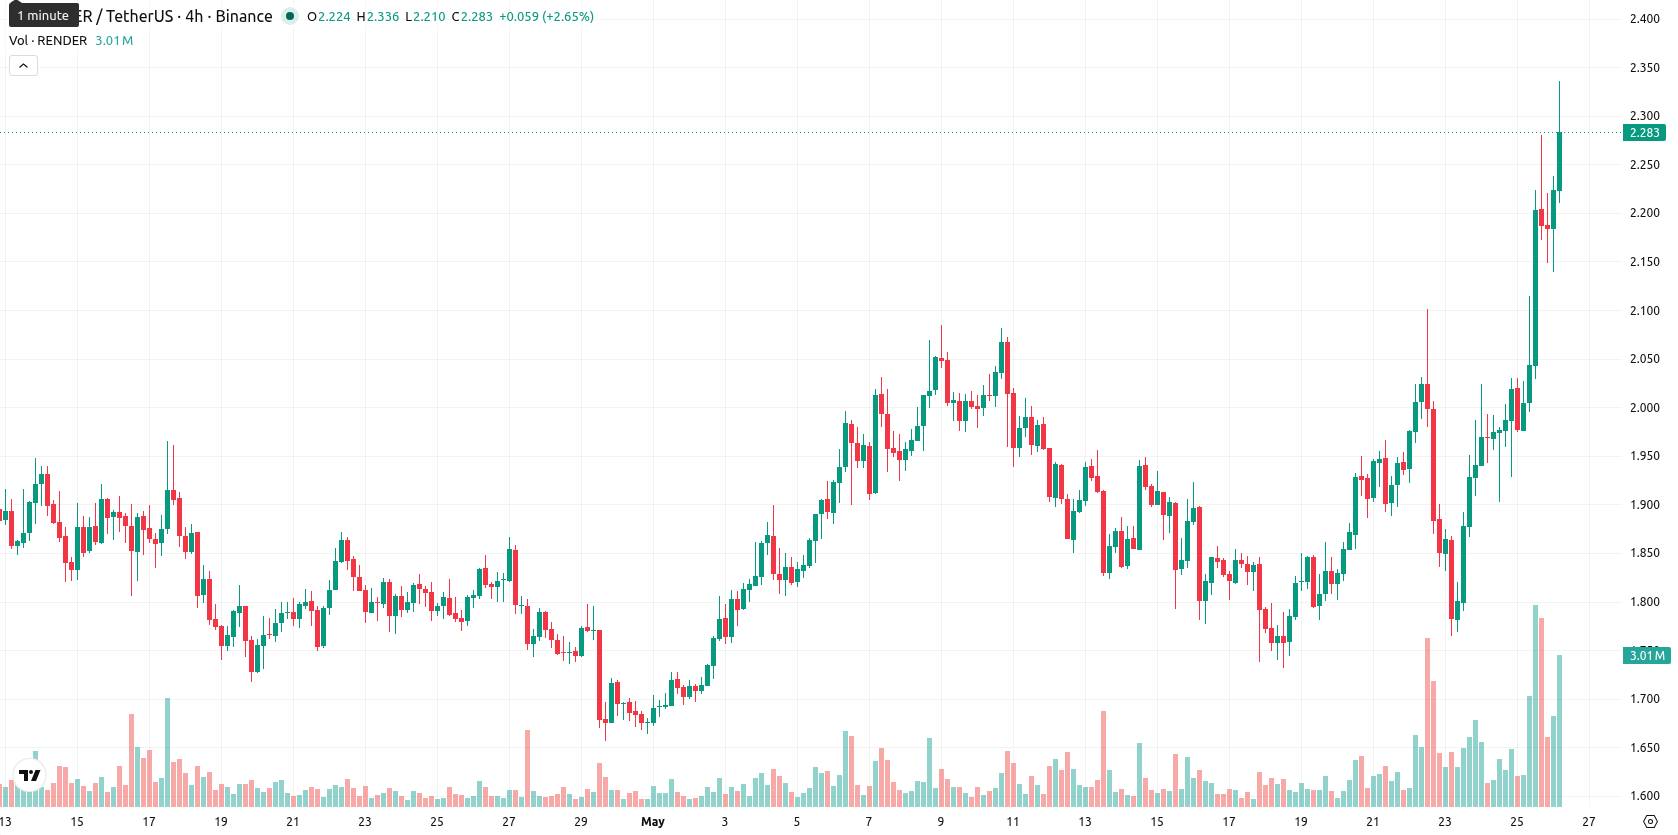
+13.40% for Render as breakout momentum meets $2.322 barrier

Render (RENDER) is trading at $2.277, up 13.40% on the day and sitting well above its key moving averages, reflecting strong positive momentum.
Highlights
- RENDER maintains a bullish structure, trading well above key short-, medium-, and long-term moving averages.
- Momentum indicators are strongly bullish but signal significant overbought conditions and potential short-term exhaustion.
- For the next five days, RENDER is expected to consolidate between $2.208 and $2.322, with downside risk if $2.208 support breaks.
Bullish signals meet overbought exhaustion as volatility jumps
SMA-20 is at $1.9299, SMA-50 is at $1.8782, and SMA-200 stands at $1.7485, placing all major averages below the current price. The Ichimoku Kijun level on the daily timeframe is $1.9720 and acts as immediate support. The session opened with a notable gap up ($2.184 vs. $2.008 previous close), and price is tracking near its daily high amid elevated volatility. Momentum indicators remain bullish with MACD and RSI on buy signals; however, D1 ADX at 17.62 is neutral, reflecting that the strength of the trend is not yet robust. Both the RSI (69.05) and CCI (221.96) indicate overbought conditions, with Stoch RSI fully overbought at 100. Bull/Bear Power (BBP) is strongly positive at +0.335, and the Awesome Oscillator further supports bullish momentum, though several oscillators warn of short-term exhaustion and divergence.
Consolidation likely as overbought levels dampen upside potential
Over the next five trading days, RENDER is expected to consolidate within a typical volatility range of $2.208 to $2.322. The probability of a further sustained advance is low (less than 20%), while a sideways or downward move is more likely given the overbought status of several key oscillators. A push above $2.322 would suggest renewed upside momentum, but a failure to hold above $2.208 increases the risk of a deeper pullback as oscillators revert from extreme readings.
Earlier, analysts noted that Render was enjoying strong bullish momentum fueled by rising investor interest and technical strength. The current technical setup introduces a higher risk of near-term volatility, making it critical for traders to monitor the $2.208 support zone for signs of either consolidation or a deeper pullback.


Latest Render News


-
 Afghanistan
-
 Albania
-
 Algeria
-
 Angola
-
 Argentina
-
 Armenia
-
 Australia
-
 Austria
-
 Azerbaijan
-
 Bahamas
-
 Bahrain
-
 Bangladesh
-
 Belarus
-
 Belgium
-
 Bolivia
-
 Botswana
-
 Brazil
-
 Brunei
-
 Bulgaria
-
 Cambodia
-
 Cameroon
-
 Canada
-
 Chile
Chile
-
 China
China
-
 Colombia
-
 Congo
Congo
-
 Costa Rica
-
 Cote d'Ivoire
-
 Croatia
-
 Cuba
Cuba
-
 Cyprus
-
 Czechia
-
 DR Congo
-
 Denmark
-
 Dominican Republic
-
 Ecuador
-
 Egypt
Egypt
-
 El Salvador
-
 Estonia
-
 Eswatini
-
 Ethiopia
-
 Finland
-
 France
-
 Georgia
-
 Germany
-
 Ghana
Ghana
-
 Greece
-
 Haiti
Haiti
-
 Hong Kong
-
 Hungary
-
 India
India
-
 Indonesia
-
 Iran, Islamic republic
-
 Iraq
Iraq
-
 Ireland
-
 Israel
-
 Italy
Italy
-
 Jamaica
-
 Japan
Japan
-
 Jordan
-
 Kazakhstan
-
 Kenya
Kenya
-
 Korea
Korea
-
 Kuwait
-
 Kyrgyzstan
-
 Laos
Laos
-
 Latvia
-
 Lebanon
-
 Lesotho
-
 Libya
Libya
-
 Lithuania
-
 Luxembourg
-
 Madagascar
-
 Malaysia
-
 Malta
Malta
-
 Mauritius
-
 Mexico
-
 Moldova
-
 Mongolia
-
 Montenegro
-
 Morocco
-
 Mozambique
-
 Myanmar
-
 Namibia
-
 Nepal
Nepal
-
 Netherlands
-
 New Zealand
-
 Nigeria
-
 North Macedonia
-
 Norway
-
 Oman
Oman
-
 Pakistan
-
 Palestine
-
 Panama
-
 Papua New Guinea
-
 Paraguay
-
 Peru
Peru
-
 Philippines
-
 Poland
-
 Portugal
-
 Puerto Rico
-
 Qatar
Qatar
-
 Reunion
-
 Romania
-
 Rwanda
-
 Saudi Arabia
-
 Serbia
-
 Singapore
-
 Slovakia
-
 Slovenia
-
 Somalia
-
 South Africa
-
 Spain
Spain
-
 Sri Lanka
-
 Sweden
-
 Switzerland
-
 Syria
Syria
-
 Taiwan
-
 Tajikistan
-
 Tanzania
-
 Thailand
-
 Trinidad and Tobago
-
 Tunisia
-
 Turkey
-
 UAE
UAE
-
 Uganda
-
 Ukraine
-
 United Kingdom
-
United States
-
 Uruguay
-
 Uzbekistan
-
 Venezuela
-
 Vietnam
-
 Yemen
Yemen
-
 Zambia
-
 Zimbabwe
- Forex
- Crypto
