
RNDR gains as MACD shows persistent bearish momentum: weekly forecast

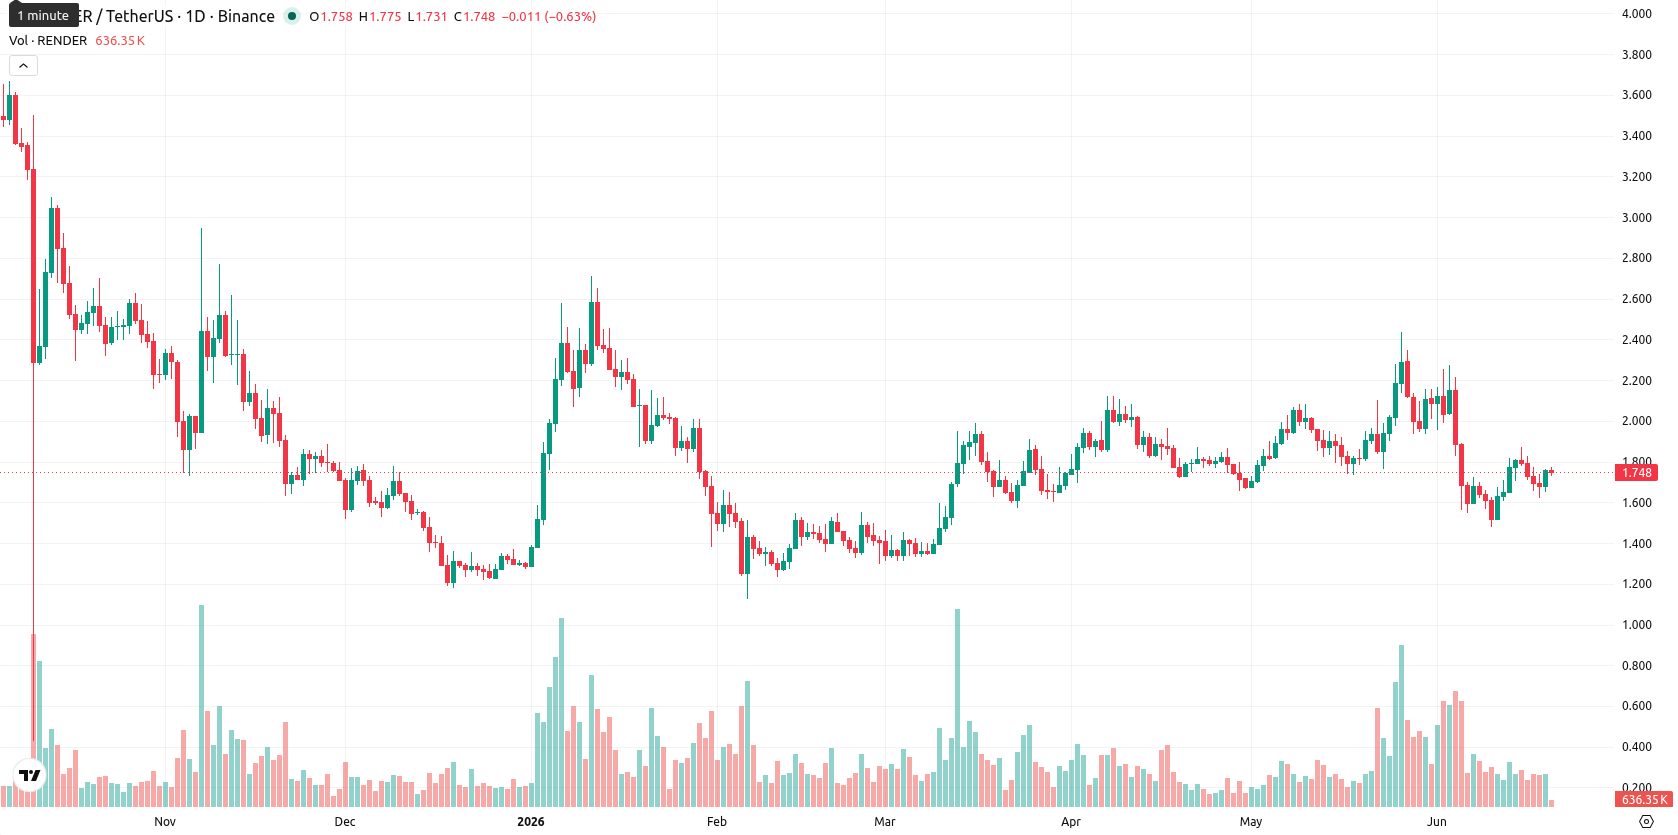
Render Network (RNDR) ended the week with a $0.07 gain, rising 4.16%. The asset is positioned above the weekly MA-20 at $1.7179 but remains capped below its MA-50 at $2.3463, highlighting a moderately supportive medium-term backdrop but with continued selling pressure from the broader trend.
Highlights
- Render is showing moderate medium-term support, trading above key support but still below major resistance, with sellers dominating the broader trend.
- Momentum and oscillator signals remain mixed and neutral overall, indicating continued indecision and lack of strong trend direction.
- Render is likely to trade sideways in the $1.65–$1.85 range over the next week, with downside risk outweighing the probability of a sustained rally.
Mixed oscillators and muted trend despite elevated volatility this week
On the weekly (W1) timeframe, Render is trading between its MA-20 and MA-50, suggesting modest short-term support but persistent medium-term resistance. Oscillators present mixed signals: the MACD reflects strong bearish momentum while the ADX is neutral, indicating weak trend strength. RSI, Stochastic RSI, and CCI are all neutral, signaling a lack of clear directional bias. Notably, Bull/Bear Power issues a mild "Buy" signal, hinting at emerging buyer interest, while overall weekly volatility is elevated at 15.43%.
Sideways bias expected as resistance caps breakout potential next week
Based on weekly indicators and elevated volatility, Render is expected to trade within the $1.65 – $1.85 corridor over the next seven days. The probability of a sustained bullish move is low, with less than a 20% chance of overcoming resistance. The base scenario calls for sideways price action near current levels. Confirmation of a bullish reversal would require a breakout above $1.85, while a decisive drop below $1.65 could signal further downside.
Earlier, analysts noted that Render was benefiting from positive momentum and heightened investor interest amid strong technical signals. The current setup marks a shift to range-bound conditions, with traders advised to monitor the $1.85 level for an early indication of renewed upward potential.


-
 Afghanistan
-
 Albania
-
 Algeria
-
 Angola
-
 Argentina
-
 Armenia
-
 Australia
-
 Austria
-
 Azerbaijan
-
 Bahamas
-
 Bahrain
-
 Bangladesh
-
 Belarus
-
 Belgium
-
 Bolivia
-
 Botswana
-
 Brazil
-
 Brunei
-
 Bulgaria
-
 Cambodia
-
 Cameroon
-
 Canada
-
 Chile
Chile
-
 China
China
-
 Colombia
-
 Congo
Congo
-
 Costa Rica
-
 Cote d'Ivoire
-
 Croatia
-
 Cuba
Cuba
-
 Cyprus
-
 Czechia
-
 DR Congo
-
 Denmark
-
 Dominican Republic
-
 Ecuador
-
 Egypt
Egypt
-
 El Salvador
-
 Estonia
-
 Eswatini
-
 Ethiopia
-
 Finland
-
 France
-
 Georgia
-
 Germany
-
 Ghana
Ghana
-
 Greece
-
 Haiti
Haiti
-
 Hong Kong
-
 Hungary
-
 India
India
-
 Indonesia
-
 Iran, Islamic republic
-
 Iraq
Iraq
-
 Ireland
-
 Israel
-
 Italy
Italy
-
 Jamaica
-
 Japan
Japan
-
 Jordan
-
 Kazakhstan
-
 Kenya
Kenya
-
 Korea
Korea
-
 Kuwait
-
 Kyrgyzstan
-
 Laos
Laos
-
 Latvia
-
 Lebanon
-
 Lesotho
-
 Libya
Libya
-
 Lithuania
-
 Luxembourg
-
 Madagascar
-
 Malaysia
-
 Malta
Malta
-
 Mauritius
-
 Mexico
-
 Moldova
-
 Mongolia
-
 Montenegro
-
 Morocco
-
 Mozambique
-
 Myanmar
-
 Namibia
-
 Nepal
Nepal
-
 Netherlands
-
 New Zealand
-
 Nigeria
-
 North Macedonia
-
 Norway
-
 Oman
Oman
-
 Pakistan
-
 Palestine
-
 Panama
-
 Papua New Guinea
-
 Paraguay
-
 Peru
Peru
-
 Philippines
-
 Poland
-
 Portugal
-
 Puerto Rico
-
 Qatar
Qatar
-
 Reunion
-
 Romania
-
 Rwanda
-
 Saudi Arabia
-
 Serbia
-
 Singapore
-
 Slovakia
-
 Slovenia
-
 Somalia
-
 South Africa
-
 Spain
Spain
-
 Sri Lanka
-
 Sweden
-
 Switzerland
-
 Syria
Syria
-
 Taiwan
-
 Tajikistan
-
 Tanzania
-
 Thailand
-
 Trinidad and Tobago
-
 Tunisia
-
 Turkey
-
 UAE
UAE
-
 Uganda
-
 Ukraine
-
 United Kingdom
-
United States
-
 Uruguay
-
 Uzbekistan
-
 Venezuela
-
 Vietnam
-
 Yemen
Yemen
-
 Zambia
-
 Zimbabwe
- Forex
- Crypto
