
High intraday volatility pushes Pendle lower, session closes near the day low

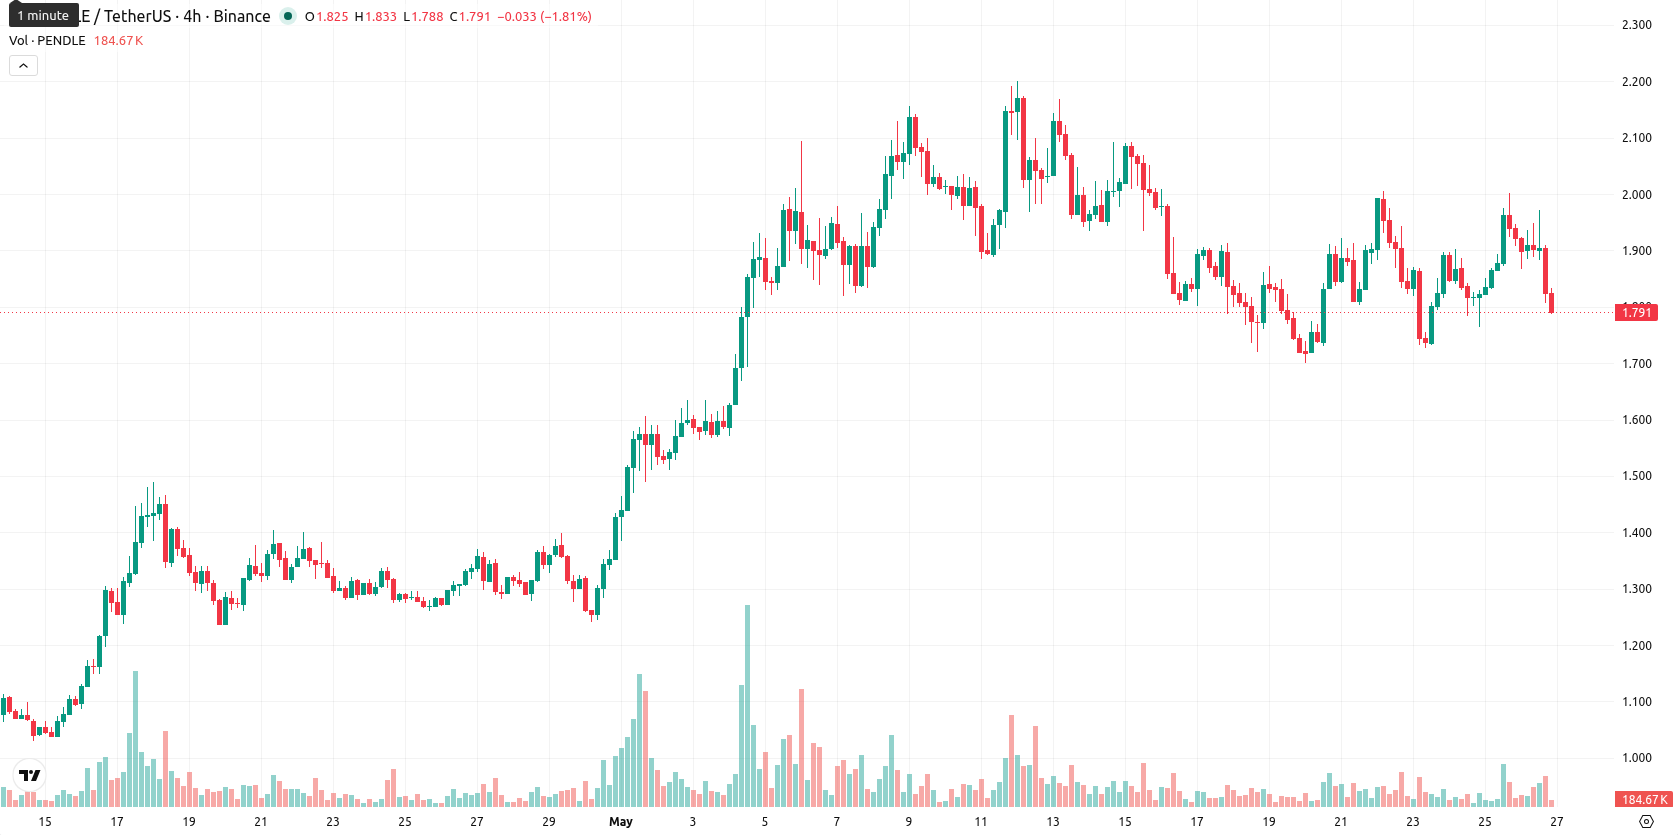
Pendle (PENDLE) is trading at $1.794, down 7.19% on the day and sitting below its short-term moving averages while maintaining a position above medium- and long-term trend levels.
Highlights
- PENDLE is showing short-term bearish momentum with price sharply down 7.19%, trading near session lows.
- Despite the downside move, momentum and trend indicators remain broadly bullish, indicating underlying buying pressure persists.
- Expected five-day trading range is $1.61 to $1.97, with a low probability of price increase and risk skewed to the downside.
Bullish momentum holds above longer support amid high volatility
On the technical front, PENDLE is currently situated below the SMA-20 ($1.9229) but remains above both the SMA-50 ($1.5536) and SMA-200 ($1.7297). The Ichimoku Kijun at $1.7210 serves as immediate support. The price is trading close to the session low of $1.802 within a high-volatility intraday range ($1.802–$1.971). Momentum indicators on the D1 chart reflect a positive underlying trend: MACD signals a strong buy, ADX is elevated at 37.5, RSI sits at 56.7 (in buy territory), Stoch RSI prints a strong buy without reaching overbought levels, while CCI is neutral and BBP is positive with a strong buy forecast.
Downside risk rises as upside probability stays limited
Looking ahead to the next five trading days, the expected volatility band is set between $1.61 and $1.97. Statistical scenarios suggest that the probability of a price increase is below 20%, pointing to a greater chance of further declines. The baseline forecast anticipates PENDLE consolidating sideways within this corridor; renewed upside momentum would require a breakout above $1.97, whereas a downside scenario could be triggered by a slip below $1.61.
Earlier, analysts noted that Pendle was exhibiting strong momentum and sustained bullish trends across key timeframes. The current technical landscape, however, highlights a shift toward consolidation with increased downside risk, making the $1.61 support level a critical threshold for traders to monitor in the near term.


Latest Pendle News


-
 Afghanistan
-
 Albania
-
 Algeria
-
 Angola
-
 Argentina
-
 Armenia
-
 Australia
-
 Austria
-
 Azerbaijan
-
 Bahamas
-
 Bahrain
-
 Bangladesh
-
 Belarus
-
 Belgium
-
 Bolivia
-
 Botswana
-
 Brazil
-
 Brunei
-
 Bulgaria
-
 Cambodia
-
 Cameroon
-
 Canada
-
 Chile
Chile
-
 China
China
-
 Colombia
-
 Congo
Congo
-
 Costa Rica
-
 Cote d'Ivoire
-
 Croatia
-
 Cuba
Cuba
-
 Cyprus
-
 Czechia
-
 DR Congo
-
 Denmark
-
 Dominican Republic
-
 Ecuador
-
 Egypt
Egypt
-
 El Salvador
-
 Estonia
-
 Eswatini
-
 Ethiopia
-
 Finland
-
 France
-
 Georgia
-
 Germany
-
 Ghana
Ghana
-
 Greece
-
 Haiti
Haiti
-
 Hong Kong
-
 Hungary
-
 India
India
-
 Indonesia
-
 Iran, Islamic republic
-
 Iraq
Iraq
-
 Ireland
-
 Israel
-
 Italy
Italy
-
 Jamaica
-
 Japan
Japan
-
 Jordan
-
 Kazakhstan
-
 Kenya
Kenya
-
 Korea
Korea
-
 Kuwait
-
 Kyrgyzstan
-
 Laos
Laos
-
 Latvia
-
 Lebanon
-
 Lesotho
-
 Libya
Libya
-
 Lithuania
-
 Luxembourg
-
 Madagascar
-
 Malaysia
-
 Malta
Malta
-
 Mauritius
-
 Mexico
-
 Moldova
-
 Mongolia
-
 Montenegro
-
 Morocco
-
 Mozambique
-
 Myanmar
-
 Namibia
-
 Nepal
Nepal
-
 Netherlands
-
 New Zealand
-
 Nigeria
-
 North Macedonia
-
 Norway
-
 Oman
Oman
-
 Pakistan
-
 Palestine
-
 Panama
-
 Papua New Guinea
-
 Paraguay
-
 Peru
Peru
-
 Philippines
-
 Poland
-
 Portugal
-
 Puerto Rico
-
 Qatar
Qatar
-
 Reunion
-
 Romania
-
 Rwanda
-
 Saudi Arabia
-
 Serbia
-
 Singapore
-
 Slovakia
-
 Slovenia
-
 Somalia
-
 South Africa
-
 Spain
Spain
-
 Sri Lanka
-
 Sweden
-
 Switzerland
-
 Syria
Syria
-
 Taiwan
-
 Tajikistan
-
 Tanzania
-
 Thailand
-
 Trinidad and Tobago
-
 Tunisia
-
 Turkey
-
 UAE
UAE
-
 Uganda
-
 Ukraine
-
 United Kingdom
-
United States
-
 Uruguay
-
 Uzbekistan
-
 Venezuela
-
 Vietnam
-
 Yemen
Yemen
-
 Zambia
-
 Zimbabwe
- Forex
- Crypto
