
Uniswap tumbles as rival SushiSwap forks pressure its market share

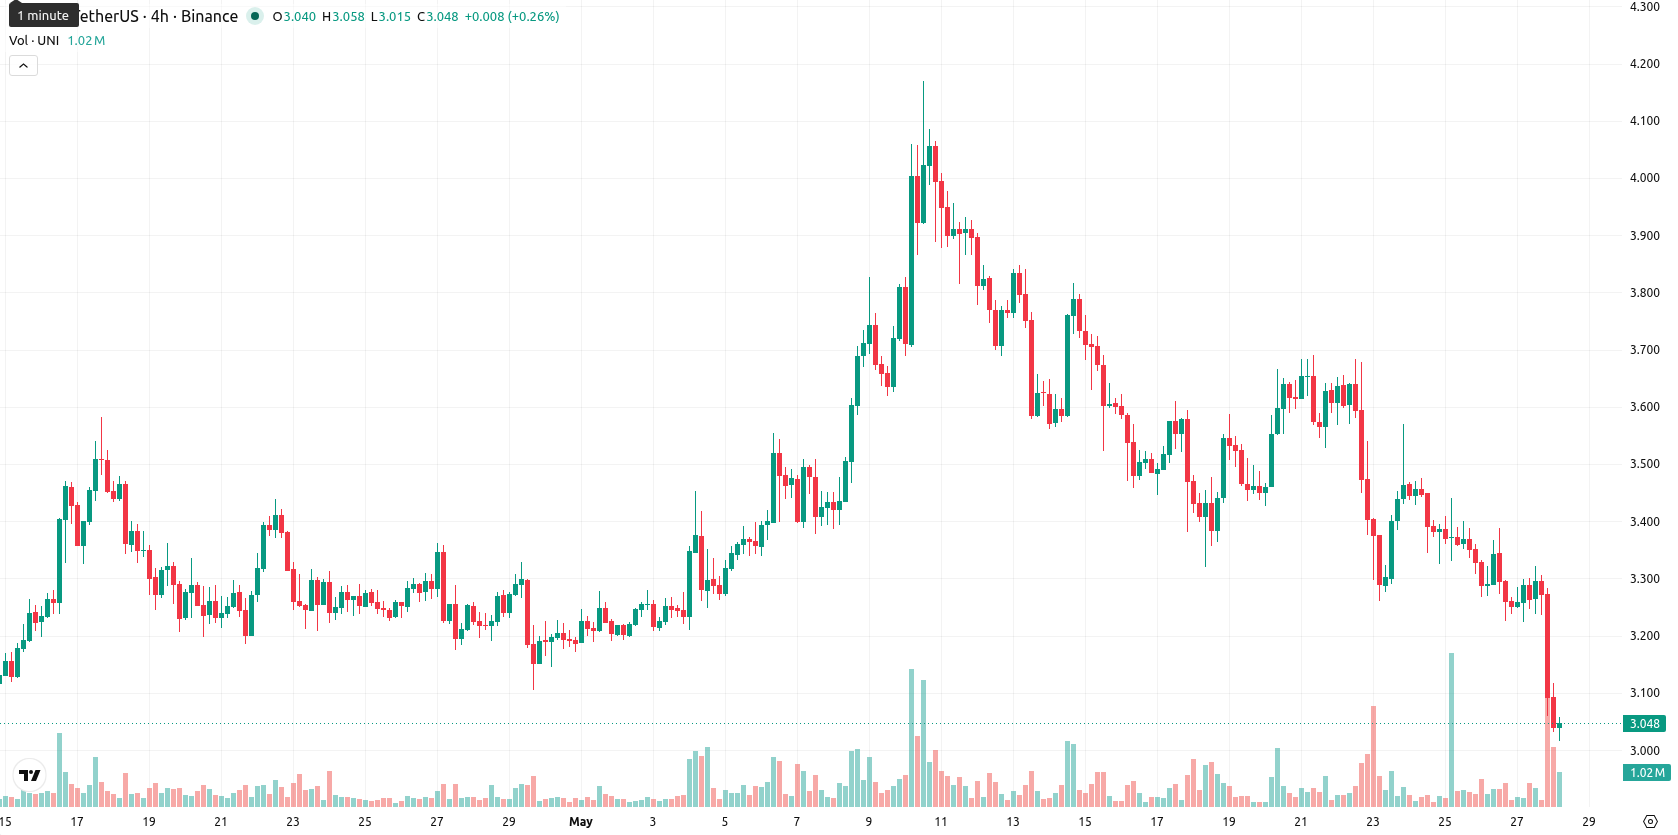
Uniswap (UNI) is trading at $3.052 after a sharp 7.06% decline today, with prices sitting below all its key moving averages. The asset remains under clear intraday pressure as it trades near the session’s low, reflecting dominant selling momentum throughout the trading day.
 3.39
3.3300
3.39
3.3300
Highlights
- Uniswap v3's concentrated liquidity feature has increased capital efficiency up to 4000-fold, reinforcing its lead with roughly 60% DEX market share.
- Ongoing protocol upgrades and UNI token governance support Uniswap's role as DEX infrastructure, despite persistent competition from forks like SushiSwap.
- UNI trades below major moving averages with momentum and oscillators confirming a strong bearish trend; price is expected to consolidate between $2.95 and $3.20, with a sub-20% probability of near-term upside.
Concentrated liquidity and competition shape Uniswap’s market dominance
Uniswap introduced concentrated liquidity with its v3 update, allowing liquidity providers to allocate capital within custom price ranges and reportedly increasing capital efficiency by up to 4000 times compared to v2. This development has supported the platform’s ability to maintain a roughly 60% share of decentralized exchange transaction volume, cementing its position as a central infrastructure in the DEX landscape. The platform’s AMM design and its system of governance through the UNI token continue to facilitate direct token swaps and protocol upgrades, though competition from alternative forks such as SushiSwap persists.
Oversold signals deepen as support zones break amid weak momentum
On the technical side, UNI is trading below the SMA-20 of $3.5623, the SMA-50 of $3.3775, and the SMA-200 of $4.4840. The Ichimoku Kijun level at $3.6225 represents immediate resistance. Momentum remains weak as the MACD continues signaling "Sell" and the ADX confirms low trend strength. The RSI stands at 36.07, while both the Stoch RSI and CCI are in oversold territory (CCI at -172.0). BBP remains negative, indicating sellers retain the upper hand intraday, and the Awesome Oscillator reads as neutral. Overall, most signals confirm oversold technical conditions, but without divergence to suggest an imminent reversal.
Sideways trading likely as bearish momentum curbs breakout odds
For the coming week, UNI is expected to consolidate in a typical volatility corridor between $2.95 and $3.20. Technical momentum remains subdued, and there is a less than 20% probability of upside given the confluence of bearish readings on the weekly MA, MACD, and RSI. The baseline case is for continued sideways trading near current levels, with a breakout above the $3.62 resistance needed to attract renewed buying interest. Conversely, a sustained move below $2.95 would likely confirm fresh selling and open the path to further declines.
Previously it was reported that Uniswap users faced significant phishing threats through malicious Google Ads impersonating the platform. While technical indicators reflect ongoing bearish momentum, traders should remain vigilant not only for downside price risk below $2.95 but also for potential scams exploiting periods of market weakness.





Latest Uniswap (UNI) News









-
 Afghanistan
-
 Albania
-
 Algeria
-
 Angola
-
 Argentina
-
 Armenia
-
 Australia
-
 Austria
-
 Azerbaijan
-
 Bahamas
-
 Bahrain
-
 Bangladesh
-
 Belarus
-
 Belgium
-
 Bolivia
-
 Botswana
-
 Brazil
-
 Brunei
-
 Bulgaria
-
 Cambodia
-
 Cameroon
-
 Canada
-
 Chile
Chile
-
 China
China
-
 Colombia
-
 Congo
Congo
-
 Costa Rica
-
 Cote d'Ivoire
-
 Croatia
-
 Cuba
Cuba
-
 Cyprus
-
 Czechia
-
 DR Congo
-
 Denmark
-
 Dominican Republic
-
 Ecuador
-
 Egypt
Egypt
-
 El Salvador
-
 Estonia
-
 Eswatini
-
 Ethiopia
-
 Finland
-
 France
-
 Georgia
-
 Germany
-
 Ghana
Ghana
-
 Greece
-
 Haiti
Haiti
-
 Hong Kong
-
 Hungary
-
 India
India
-
 Indonesia
-
 Iran, Islamic republic
-
 Iraq
Iraq
-
 Ireland
-
 Israel
-
 Italy
Italy
-
 Jamaica
-
 Japan
Japan
-
 Jordan
-
 Kazakhstan
-
 Kenya
Kenya
-
 Korea
Korea
-
 Kuwait
-
 Kyrgyzstan
-
 Laos
Laos
-
 Latvia
-
 Lebanon
-
 Lesotho
-
 Libya
Libya
-
 Lithuania
-
 Luxembourg
-
 Madagascar
-
 Malaysia
-
 Malta
Malta
-
 Mauritius
-
 Mexico
-
 Moldova
-
 Mongolia
-
 Montenegro
-
 Morocco
-
 Mozambique
-
 Myanmar
-
 Namibia
-
 Nepal
Nepal
-
 Netherlands
-
 New Zealand
-
 Nigeria
-
 North Macedonia
-
 Norway
-
 Oman
Oman
-
 Pakistan
-
 Palestine
-
 Panama
-
 Papua New Guinea
-
 Paraguay
-
 Peru
Peru
-
 Philippines
-
 Poland
-
 Portugal
-
 Puerto Rico
-
 Qatar
Qatar
-
 Reunion
-
 Romania
-
 Rwanda
-
 Saudi Arabia
-
 Serbia
-
 Singapore
-
 Slovakia
-
 Slovenia
-
 Somalia
-
 South Africa
-
 Spain
Spain
-
 Sri Lanka
-
 Sweden
-
 Switzerland
-
 Syria
Syria
-
 Taiwan
-
 Tajikistan
-
 Tanzania
-
 Thailand
-
 Trinidad and Tobago
-
 Tunisia
-
 Turkey
-
 UAE
UAE
-
 Uganda
-
 Ukraine
-
 United Kingdom
-
United States
-
 Uruguay
-
 Uzbekistan
-
 Venezuela
-
 Vietnam
-
 Yemen
Yemen
-
 Zambia
-
 Zimbabwe
- Forex
- Crypto











