
Celestia drops 10.99% as sellers press lower near $0.4100 support

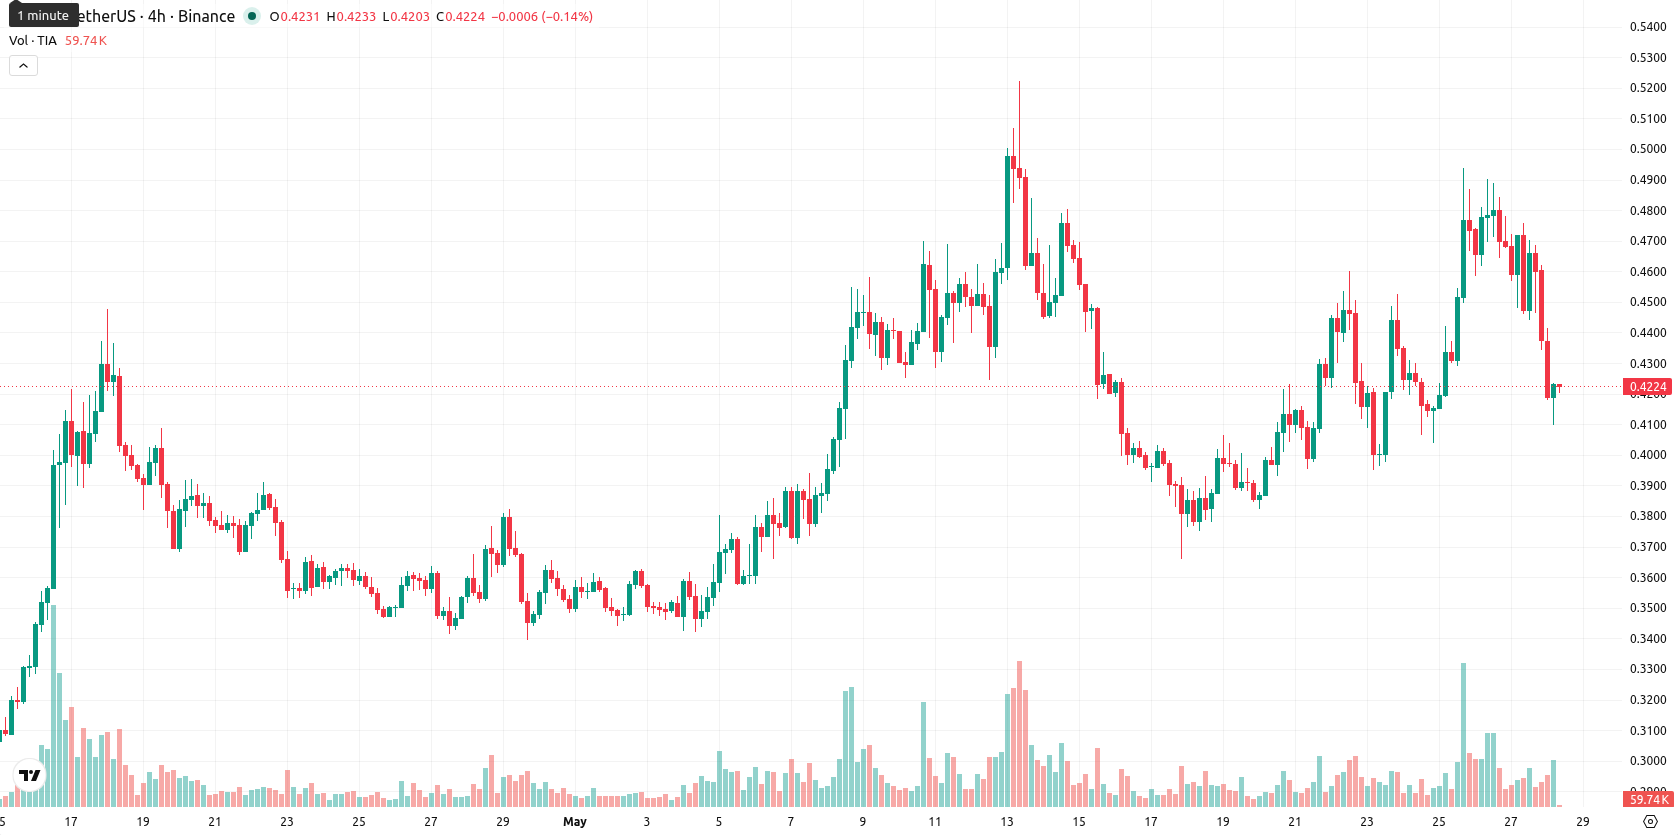
Celestia (TIA) is trading at $0.4205 today after a 10.99% decline on the session. The price currently holds below its key short- and long-term moving averages, while remaining just above one medium-term average, reflecting overall downward momentum with pockets of technical support.
Highlights
- TIA faces short-term selling pressure and long-term resistance as it trades below key moving averages.
- Bullish and bearish momentum indicators diverge, with mild underlying strength challenged by increased intraday selling activity.
- Price is expected to range between $0.4100 and $0.4400 over the next five sessions, with downside risks prevailing if support at $0.4100 fails.
Mixed momentum as positive signals diverge from intraday weakness
On the technical front, TIA trades below the MA-20 ($0.4317) and MA-200 ($0.4480), while staying above the MA-50 ($0.3844). Immediate resistance appears at the Ichimoku Kijun level of $0.4322. Daily MACD and ADX readings remain positive, showing some underlying bullish tendencies, whereas the Stoch RSI is in sell territory and the standard RSI is above 50 but not overbought, suggesting mild positive momentum. D1 CCI is neutral and BBP shows buyers dominating intraday, while the Awesome Oscillator (AO) remains mildly positive. Still, price action closed near the daily low ($0.4106–$0.441 range), indicating strong intraday volatility and pressure after the open, with the divergence between momentum and daily movement warranting increased caution.
Limited upside risk as technicals favor range-bound trade
Over the short term, TIA is likely to trade between $0.4100 and $0.4400, representing its expected five-session volatility band. There is less than a 20% probability of a sharp upside move, with range-bound or lower trade favored based on the majority of weekly signals pointing to weakness. A break above $0.4322 would open a bullish scenario, while a fall below $0.4100 would expose further downside risk.
Earlier, analysts noted that Celestia was experiencing mixed technical signals and elevated volatility, indicating caution amid prevailing downside risks. The latest developments reinforce this view, with current market action highlighting $0.4100 as a crucial level for downside monitoring in the coming sessions.


Latest Celestia News


-
 Afghanistan
-
 Albania
-
 Algeria
-
 Angola
-
 Argentina
-
 Armenia
-
 Australia
-
 Austria
-
 Azerbaijan
-
 Bahamas
-
 Bahrain
-
 Bangladesh
-
 Belarus
-
 Belgium
-
 Bolivia
-
 Botswana
-
 Brazil
-
 Brunei
-
 Bulgaria
-
 Cambodia
-
 Cameroon
-
 Canada
-
 Chile
Chile
-
 China
China
-
 Colombia
-
 Congo
Congo
-
 Costa Rica
-
 Cote d'Ivoire
-
 Croatia
-
 Cuba
Cuba
-
 Cyprus
-
 Czechia
-
 DR Congo
-
 Denmark
-
 Dominican Republic
-
 Ecuador
-
 Egypt
Egypt
-
 El Salvador
-
 Estonia
-
 Eswatini
-
 Ethiopia
-
 Finland
-
 France
-
 Georgia
-
 Germany
-
 Ghana
Ghana
-
 Greece
-
 Haiti
Haiti
-
 Hong Kong
-
 Hungary
-
 India
India
-
 Indonesia
-
 Iran, Islamic republic
-
 Iraq
Iraq
-
 Ireland
-
 Israel
-
 Italy
Italy
-
 Jamaica
-
 Japan
Japan
-
 Jordan
-
 Kazakhstan
-
 Kenya
Kenya
-
 Korea
Korea
-
 Kuwait
-
 Kyrgyzstan
-
 Laos
Laos
-
 Latvia
-
 Lebanon
-
 Lesotho
-
 Libya
Libya
-
 Lithuania
-
 Luxembourg
-
 Madagascar
-
 Malaysia
-
 Malta
Malta
-
 Mauritius
-
 Mexico
-
 Moldova
-
 Mongolia
-
 Montenegro
-
 Morocco
-
 Mozambique
-
 Myanmar
-
 Namibia
-
 Nepal
Nepal
-
 Netherlands
-
 New Zealand
-
 Nigeria
-
 North Macedonia
-
 Norway
-
 Oman
Oman
-
 Pakistan
-
 Palestine
-
 Panama
-
 Papua New Guinea
-
 Paraguay
-
 Peru
Peru
-
 Philippines
-
 Poland
-
 Portugal
-
 Puerto Rico
-
 Qatar
Qatar
-
 Reunion
-
 Romania
-
 Rwanda
-
 Saudi Arabia
-
 Serbia
-
 Singapore
-
 Slovakia
-
 Slovenia
-
 Somalia
-
 South Africa
-
 Spain
Spain
-
 Sri Lanka
-
 Sweden
-
 Switzerland
-
 Syria
Syria
-
 Taiwan
-
 Tajikistan
-
 Tanzania
-
 Thailand
-
 Trinidad and Tobago
-
 Tunisia
-
 Turkey
-
 UAE
UAE
-
 Uganda
-
 Ukraine
-
 United Kingdom
-
United States
-
 Uruguay
-
 Uzbekistan
-
 Venezuela
-
 Vietnam
-
 Yemen
Yemen
-
 Zambia
-
 Zimbabwe
- Forex
- Crypto
