
Pendle sinks 13.59% as sharp drop takes price below key averages

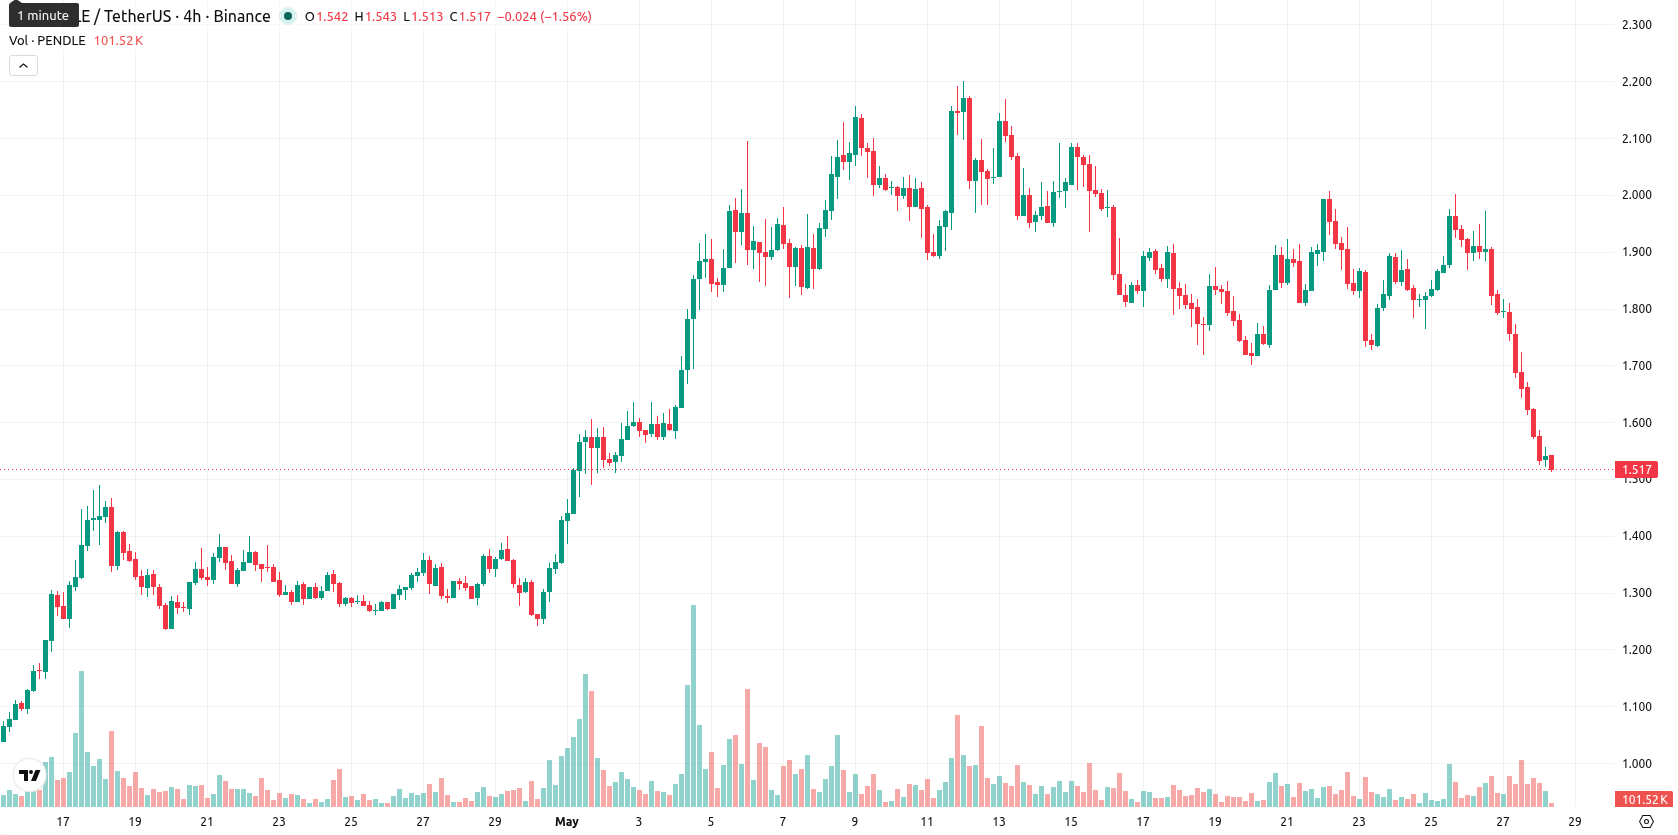
Pendle (PENDLE) is trading at $1.519 after a sharp daily decline of 13.59%. The price is positioned below its key moving averages, indicating ongoing seller pressure.
Highlights
- PENDLE price action remains bearish, trading below key moving averages and facing sustained selling pressure across all timeframes.
- Momentum indicators show predominantly oversold signals despite a brief MACD-based rebound, with volatility elevated and downside pressure persisting after a 13.59% daily drop.
- Expected trading range for the next five days is $1.48–$1.68; a move below $1.48 suggests further losses, while a breakout above $1.85 signals upside.
Oversold signals intensify with resistance holding after volatility spike
The 20-, 50-, and 200-day moving averages are placed at $1.9003, $1.5791, and $1.7188, respectively, each above the last close. The Ichimoku Kijun level on D1 stands considerably higher at $1.8555 and forms immediate chart resistance. On the momentum side, the daily MACD reads as 'Strong Buy' while the ADX (35.54) reflects an active trend. However, the RSI has slipped to 41.55, Stoch RSI is at 0.00, and CCI is deeply negative at -178.76, all confirming oversold conditions. The BBP is barely positive but flagged as a 'Buy' for weak buyer activity, and the Awesome Oscillator remains neutral. Today's session has traded close to the intraday low, within a narrow range, following a wave of increased volatility and sustained downside pressure.
Sideways-to-lower bias persists as breakout risks build at extremes
Over the next five trading days, PENDLE is projected to fluctuate within a $1.48 to $1.68 volatility band relative to current levels. With less than a 20% probability of a price increase and multi-indicator momentum trends remaining bearish on the weekly frame, the base expectation is for continued sideways-to-lower movement inside this range. If PENDLE breaches and closes above $1.85, it could trigger a breakout toward higher levels. Conversely, consistent closes below $1.48 would raise the risk of new local lows.
Earlier, analysts noted that Pendle faced persistent downside pressure amid mixed technical signals and heightened uncertainty. This outlook is reinforced by the latest session's momentum shifts and oversold readings, suggesting traders should closely monitor the $1.48 support level for signs of renewed volatility or a potential breakdown.


Latest Pendle News


-
 Afghanistan
-
 Albania
-
 Algeria
-
 Angola
-
 Argentina
-
 Armenia
-
 Australia
-
 Austria
-
 Azerbaijan
-
 Bahamas
-
 Bahrain
-
 Bangladesh
-
 Belarus
-
 Belgium
-
 Bolivia
-
 Botswana
-
 Brazil
-
 Brunei
-
 Bulgaria
-
 Cambodia
-
 Cameroon
-
 Canada
-
 Chile
Chile
-
 China
China
-
 Colombia
-
 Congo
Congo
-
 Costa Rica
-
 Cote d'Ivoire
-
 Croatia
-
 Cuba
Cuba
-
 Cyprus
-
 Czechia
-
 DR Congo
-
 Denmark
-
 Dominican Republic
-
 Ecuador
-
 Egypt
Egypt
-
 El Salvador
-
 Estonia
-
 Eswatini
-
 Ethiopia
-
 Finland
-
 France
-
 Georgia
-
 Germany
-
 Ghana
Ghana
-
 Greece
-
 Haiti
Haiti
-
 Hong Kong
-
 Hungary
-
 India
India
-
 Indonesia
-
 Iran, Islamic republic
-
 Iraq
Iraq
-
 Ireland
-
 Israel
-
 Italy
Italy
-
 Jamaica
-
 Japan
Japan
-
 Jordan
-
 Kazakhstan
-
 Kenya
Kenya
-
 Korea
Korea
-
 Kuwait
-
 Kyrgyzstan
-
 Laos
Laos
-
 Latvia
-
 Lebanon
-
 Lesotho
-
 Libya
Libya
-
 Lithuania
-
 Luxembourg
-
 Madagascar
-
 Malaysia
-
 Malta
Malta
-
 Mauritius
-
 Mexico
-
 Moldova
-
 Mongolia
-
 Montenegro
-
 Morocco
-
 Mozambique
-
 Myanmar
-
 Namibia
-
 Nepal
Nepal
-
 Netherlands
-
 New Zealand
-
 Nigeria
-
 North Macedonia
-
 Norway
-
 Oman
Oman
-
 Pakistan
-
 Palestine
-
 Panama
-
 Papua New Guinea
-
 Paraguay
-
 Peru
Peru
-
 Philippines
-
 Poland
-
 Portugal
-
 Puerto Rico
-
 Qatar
Qatar
-
 Reunion
-
 Romania
-
 Rwanda
-
 Saudi Arabia
-
 Serbia
-
 Singapore
-
 Slovakia
-
 Slovenia
-
 Somalia
-
 South Africa
-
 Spain
Spain
-
 Sri Lanka
-
 Sweden
-
 Switzerland
-
 Syria
Syria
-
 Taiwan
-
 Tajikistan
-
 Tanzania
-
 Thailand
-
 Trinidad and Tobago
-
 Tunisia
-
 Turkey
-
 UAE
UAE
-
 Uganda
-
 Ukraine
-
 United Kingdom
-
United States
-
 Uruguay
-
 Uzbekistan
-
 Venezuela
-
 Vietnam
-
 Yemen
Yemen
-
 Zambia
-
 Zimbabwe
- Forex
- Crypto
