
+7.7% for VeChain as price trades well below long-term average

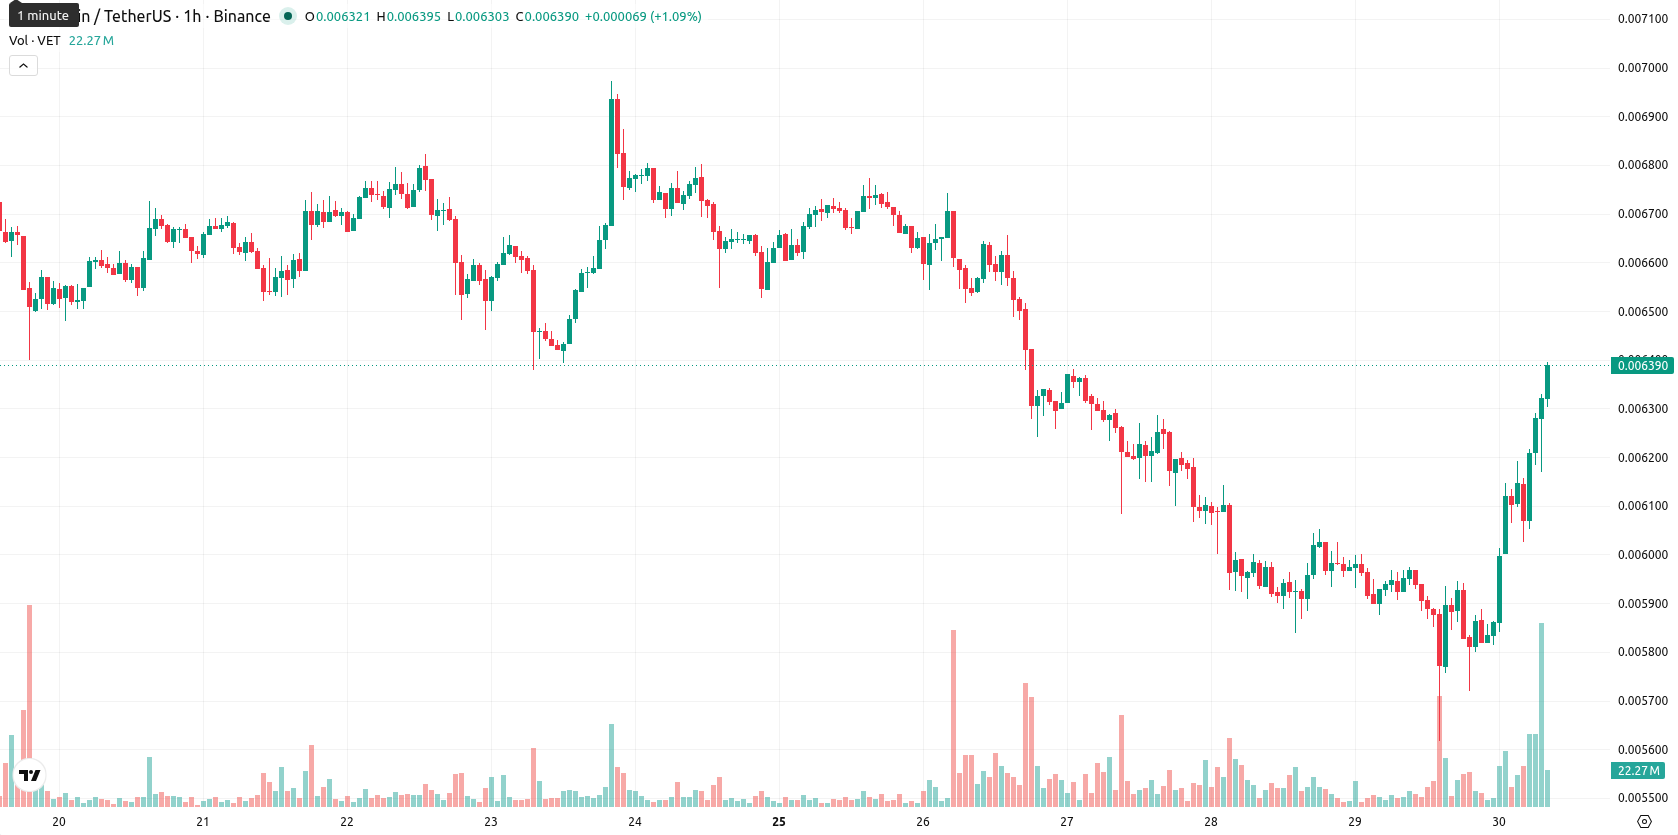
VeChain (VET) is trading at $0.006395 after a 7.70% rise in the last 24 hours. The price remains below its key moving averages and is positioned in a recovery move from recent lows.
Highlights
- $VET remains under bearish pressure, trading below short-, medium-, and long-term moving averages.
- Momentum indicators show a deeply oversold setup with weak buying interest, despite a recent 7.7% intraday rebound.
- Near-term trading is likely confined to a $0.00616–$0.00664 range, with a breakdown below $0.00616 signaling further downside.
Bearish momentum persists as oversold readings and resistance pressure
VET is currently trading below the SMA-20 at $0.00678975, SMA-50 at $0.00705178, and SMA-200 at $0.00920870, demonstrating that the asset is under all major moving average thresholds. The Ichimoku Kijun line marks immediate resistance at $0.00686950. On the momentum side, the MACD and ADX show a lack of buyer strength, with the RSI at 29.53 and CCI at -155.3 both highlighting deeply oversold conditions. The Stoch RSI registers at zero, and BBP remains negative, confirming persistent seller dominance. Although the session’s price action is now near its intraday high within a moderately volatile range, this stands in clear contrast with the prevailing bearish signals from these technical indicators.
Sideways movement likely amid limited breakout probabilities
In the short term, VET is expected to trade within a range of $0.00616 to $0.00664 based on typical volatility for the next five sessions, with upward breakouts above this range seen as unlikely (probability less than 20%). The baseline scenario is for sideways consolidation within this corridor, reflecting uncertainty. A strong close above $0.00687 would open potential to move toward $0.00695–$0.00705, while a break below $0.00616 could accelerate a move toward prior low levels.
Earlier, analysts noted that VeChain was entrenched in a persistent bearish trend with little indication of a near-term reversal. While the latest price rebound offers evidence of reactive buying interest, the technical backdrop reinforces that traders should remain vigilant for renewed downside risk if support at $0.00616 is breached.


-
 Afghanistan
-
 Albania
-
 Algeria
-
 Angola
-
 Argentina
-
 Armenia
-
 Australia
-
 Austria
-
 Azerbaijan
-
 Bahamas
-
 Bahrain
-
 Bangladesh
-
 Belarus
-
 Belgium
-
 Bolivia
-
 Botswana
-
 Brazil
-
 Brunei
-
 Bulgaria
-
 Cambodia
-
 Cameroon
-
 Canada
-
 Chile
Chile
-
 China
China
-
 Colombia
-
 Congo
Congo
-
 Costa Rica
-
 Cote d'Ivoire
-
 Croatia
-
 Cuba
Cuba
-
 Cyprus
-
 Czechia
-
 DR Congo
-
 Denmark
-
 Dominican Republic
-
 Ecuador
-
 Egypt
Egypt
-
 El Salvador
-
 Estonia
-
 Eswatini
-
 Ethiopia
-
 Finland
-
 France
-
 Georgia
-
 Germany
-
 Ghana
Ghana
-
 Greece
-
 Haiti
Haiti
-
 Hong Kong
-
 Hungary
-
 India
India
-
 Indonesia
-
 Iran, Islamic republic
-
 Iraq
Iraq
-
 Ireland
-
 Israel
-
 Italy
Italy
-
 Jamaica
-
 Japan
Japan
-
 Jordan
-
 Kazakhstan
-
 Kenya
Kenya
-
 Korea
Korea
-
 Kuwait
-
 Kyrgyzstan
-
 Laos
Laos
-
 Latvia
-
 Lebanon
-
 Lesotho
-
 Libya
Libya
-
 Lithuania
-
 Luxembourg
-
 Madagascar
-
 Malaysia
-
 Malta
Malta
-
 Mauritius
-
 Mexico
-
 Moldova
-
 Mongolia
-
 Montenegro
-
 Morocco
-
 Mozambique
-
 Myanmar
-
 Namibia
-
 Nepal
Nepal
-
 Netherlands
-
 New Zealand
-
 Nigeria
-
 North Macedonia
-
 Norway
-
 Oman
Oman
-
 Pakistan
-
 Palestine
-
 Panama
-
 Papua New Guinea
-
 Paraguay
-
 Peru
Peru
-
 Philippines
-
 Poland
-
 Portugal
-
 Puerto Rico
-
 Qatar
Qatar
-
 Reunion
-
 Romania
-
 Rwanda
-
 Saudi Arabia
-
 Serbia
-
 Singapore
-
 Slovakia
-
 Slovenia
-
 Somalia
-
 South Africa
-
 Spain
Spain
-
 Sri Lanka
-
 Sweden
-
 Switzerland
-
 Syria
Syria
-
 Taiwan
-
 Tajikistan
-
 Tanzania
-
 Thailand
-
 Trinidad and Tobago
-
 Tunisia
-
 Turkey
-
 UAE
UAE
-
 Uganda
-
 Ukraine
-
 United Kingdom
-
United States
-
 Uruguay
-
 Uzbekistan
-
 Venezuela
-
 Vietnam
-
 Yemen
Yemen
-
 Zambia
-
 Zimbabwe
- Forex
- Crypto
