
Ethereum Classic weakens as volatility spikes to 13.98 percent: weekly report

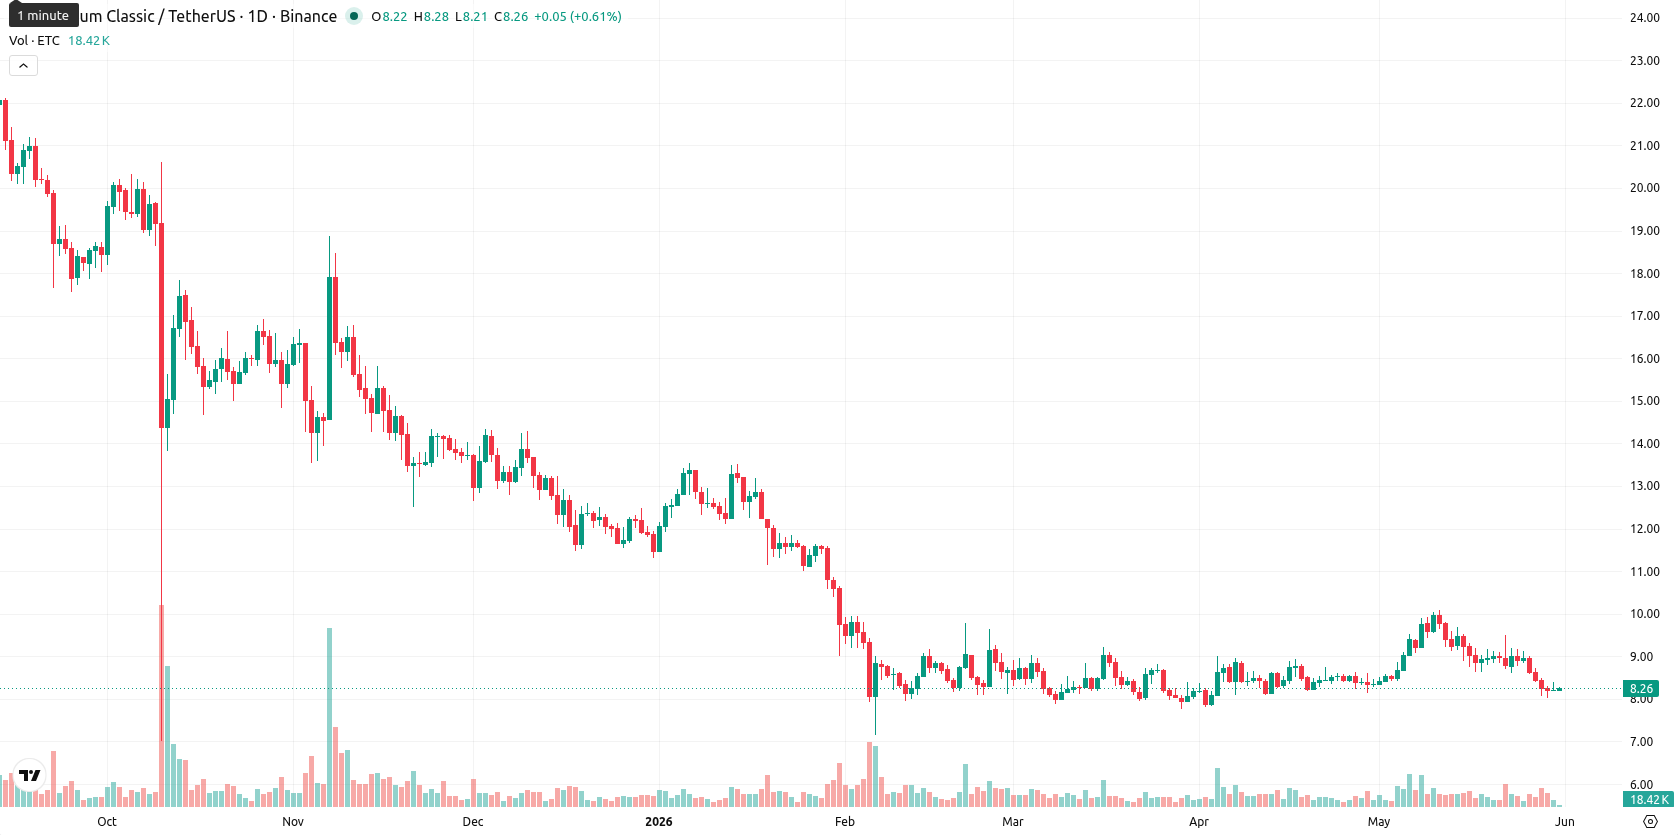
Ethereum Classic (ETC) is trading at $8.26, positioned below its weekly MA-20 of $8.89, well under the MA-50 at $14.02, and significantly beneath the MA-200 at $20.12. Over the last week, ETC declined by $0.72 (8.13%), closing in the lower part of its weekly range and remaining under pressure relative to all major weekly moving averages.
Highlights
- Ethereum Classic remains under sustained selling pressure, trading below major moving averages and closing the week down 8.13%.
- Technical indicator consensus is firmly bearish, with momentum oscillators and trend signals highlighting persistent downside bias and seller dominance.
- Expected price action this week is consolidation between $7.10 and $9.36, with a decline below $7.10 more probable than a bullish reversal.
Bearish momentum accelerates over the week as volatility rises
Weekly technical momentum for ETC remains decisively bearish, with both the MACD and ADX confirming a downtrend, while RSI and CCI signal sell conditions. Bull/Bear Power sits in oversold territory, underscoring sustained seller strength. Weekly volatility is elevated at 13.98%, and ETC closed well beneath its primary moving averages, with resistance now clustered near $8.89 (MA-20) and further at $14.02 (MA-50); weekly support is defined at $7.10, while resistance is visible at $9.36 and $14.02.
Downside bias for next week as support faces renewed pressure
For the next 7 days, ETC is expected to consolidate between $7.10 and $9.36 as the market absorbs recent losses. Downside momentum makes a decline more likely, with less than a 20% probability of a sustained move above $9.36. The baseline scenario is sideways movement in the identified range, with risk skewed toward a test or break below $7.10 if seller pressure persists, while only a sharp reversal above $9.36 would hint at a potential short-term bullish breakout.
Earlier, analysts noted that Ethereum Classic was experiencing persistent bearish momentum amid continued consolidation beneath key resistance levels. The latest data reinforces this outlook, highlighting the importance of monitoring the $7.10 support zone for any signs of further downside or a potential shift in sentiment.


Latest Ethereum Classic (ETC) News


-
 Afghanistan
-
 Albania
-
 Algeria
-
 Angola
-
 Argentina
-
 Armenia
-
 Australia
-
 Austria
-
 Azerbaijan
-
 Bahamas
-
 Bahrain
-
 Bangladesh
-
 Belarus
-
 Belgium
-
 Bolivia
-
 Botswana
-
 Brazil
-
 Brunei
-
 Bulgaria
-
 Cambodia
-
 Cameroon
-
 Canada
-
 Chile
Chile
-
 China
China
-
 Colombia
-
 Congo
Congo
-
 Costa Rica
-
 Cote d'Ivoire
-
 Croatia
-
 Cuba
Cuba
-
 Cyprus
-
 Czechia
-
 DR Congo
-
 Denmark
-
 Dominican Republic
-
 Ecuador
-
 Egypt
Egypt
-
 El Salvador
-
 Estonia
-
 Eswatini
-
 Ethiopia
-
 Finland
-
 France
-
 Georgia
-
 Germany
-
 Ghana
Ghana
-
 Greece
-
 Haiti
Haiti
-
 Hong Kong
-
 Hungary
-
 India
India
-
 Indonesia
-
 Iran, Islamic republic
-
 Iraq
Iraq
-
 Ireland
-
 Israel
-
 Italy
Italy
-
 Jamaica
-
 Japan
Japan
-
 Jordan
-
 Kazakhstan
-
 Kenya
Kenya
-
 Korea
Korea
-
 Kuwait
-
 Kyrgyzstan
-
 Laos
Laos
-
 Latvia
-
 Lebanon
-
 Lesotho
-
 Libya
Libya
-
 Lithuania
-
 Luxembourg
-
 Madagascar
-
 Malaysia
-
 Malta
Malta
-
 Mauritius
-
 Mexico
-
 Moldova
-
 Mongolia
-
 Montenegro
-
 Morocco
-
 Mozambique
-
 Myanmar
-
 Namibia
-
 Nepal
Nepal
-
 Netherlands
-
 New Zealand
-
 Nigeria
-
 North Macedonia
-
 Norway
-
 Oman
Oman
-
 Pakistan
-
 Palestine
-
 Panama
-
 Papua New Guinea
-
 Paraguay
-
 Peru
Peru
-
 Philippines
-
 Poland
-
 Portugal
-
 Puerto Rico
-
 Qatar
Qatar
-
 Reunion
-
 Romania
-
 Rwanda
-
 Saudi Arabia
-
 Serbia
-
 Singapore
-
 Slovakia
-
 Slovenia
-
 Somalia
-
 South Africa
-
 Spain
Spain
-
 Sri Lanka
-
 Sweden
-
 Switzerland
-
 Syria
Syria
-
 Taiwan
-
 Tajikistan
-
 Tanzania
-
 Thailand
-
 Trinidad and Tobago
-
 Tunisia
-
 Turkey
-
 UAE
UAE
-
 Uganda
-
 Ukraine
-
 United Kingdom
-
United States
-
 Uruguay
-
 Uzbekistan
-
 Venezuela
-
 Vietnam
-
 Yemen
Yemen
-
 Zambia
-
 Zimbabwe
- Forex
- Crypto
