

IOTA (IOTA) is trading at $0.0609, having declined 7.17% over the past 24 hours. The asset is currently positioned above its short- and medium-term moving averages but remains below longer-term trend levels.
Highlights
- IOTA's short- and medium-term trend is bullish, but strong resistance from long-term indicators limits upward movement.
- Momentum signals are mixed, with oscillators indicating overbought conditions and weak overall trend strength.
- Predicted five-day range is $0.0604–$0.0611, with bearish bias and potential for downside acceleration below $0.0604.
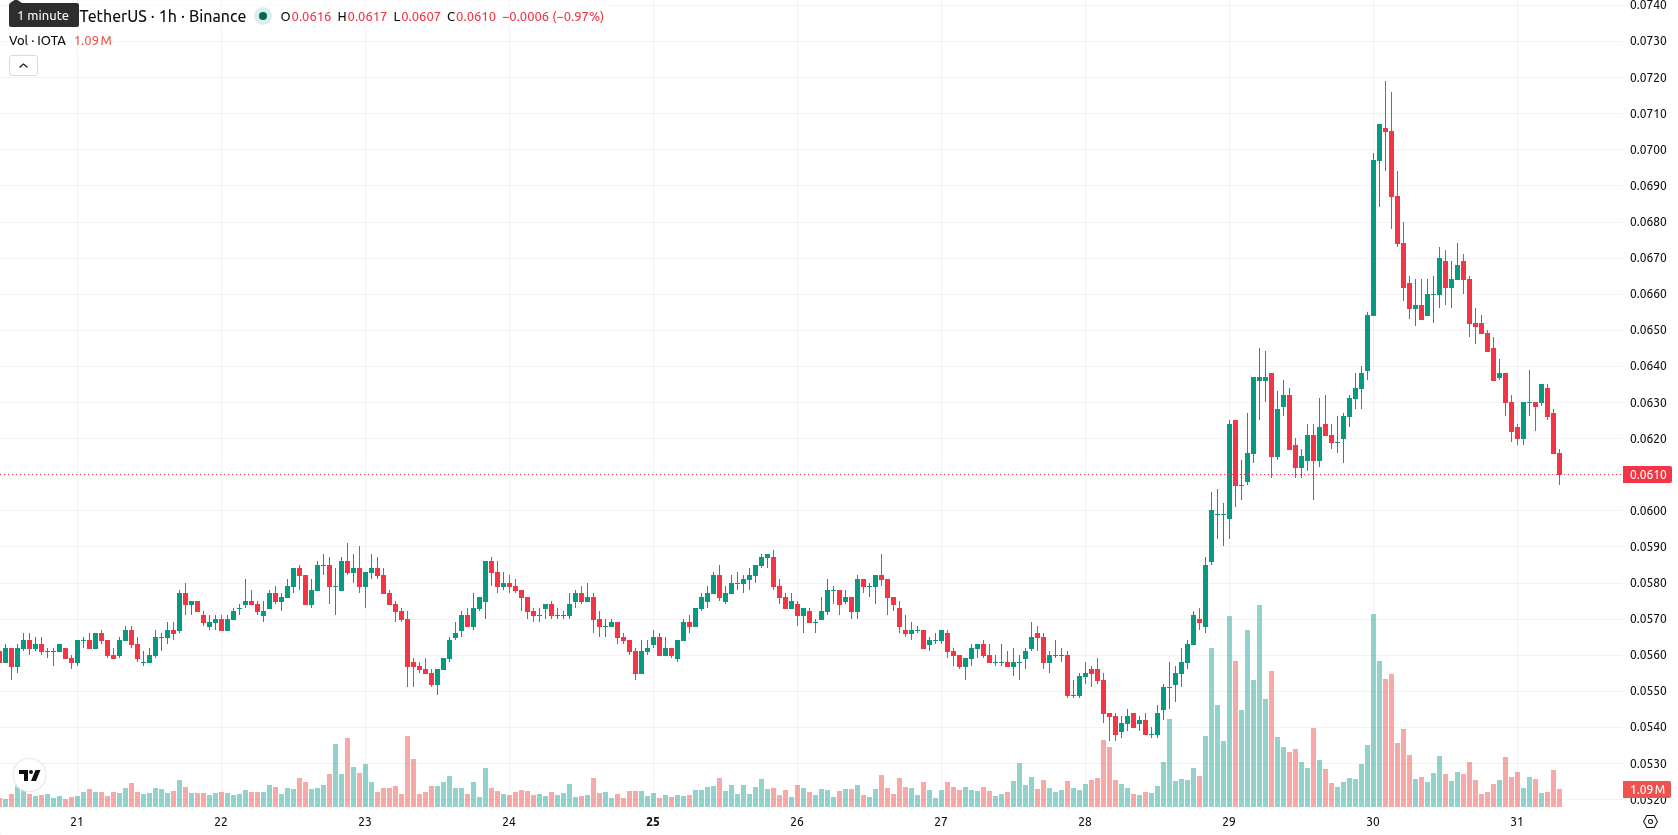
Diverging technical signals as resistance and volatility increase
The $0.0609 price level currently sits above the SMA-20 at $0.0587 and the SMA-50 at $0.0578, while remaining well below the SMA-200 at $0.0772. The Ichimoku Kijun line on the daily chart stands at $0.0626, acting as an immediate resistance, while initial support is seen at $0.0604. Daily MACD supports a bullish undertone, with the RSI in buy territory, though the ADX is neutral on both daily and weekly timeframes, indicating weak trend strength. Stoch RSI and CCI are pointing to overbought conditions, with signals of possible exhaustion, while BBP on the daily chart suggests a mild buyer advantage. The Awesome Oscillator remains constructive for bulls, but the presence of divergence among several oscillators increases short-term uncertainty. Today’s price action has featured high intraday volatility, with the price moving near the session’s low after a sharp early drop.
Downside risk elevated as weekly indicators suggest narrow range
Over the next five trading days, the anticipated price range is $0.0604 to $0.0611, reflecting a narrow volatility band relative to current levels. The probability of a further increase remains very low (under 20%), with a higher likelihood of downward movement, in line with prevailing weekly indicators. If the price closes above the immediate resistance at $0.0626, a short-term bullish scenario could unfold, but a break below $0.0604 may accelerate downside momentum.
Earlier, analysts noted that while IOTA showed signs of renewed bullish momentum, underlying technical uncertainty and overbought conditions suggested caution. The latest developments support this view, as recent downside volatility and mixed indicator signals underscore the importance of monitoring $0.0604 as a potential trigger for further short-term declines.


-
 Afghanistan
-
 Albania
-
 Algeria
-
 Angola
-
 Argentina
-
 Armenia
-
 Australia
-
 Austria
-
 Azerbaijan
-
 Bahamas
-
 Bahrain
-
 Bangladesh
-
 Belarus
-
 Belgium
-
 Bolivia
-
 Botswana
-
 Brazil
-
 Brunei
-
 Bulgaria
-
 Cambodia
-
 Cameroon
-
 Canada
-
 Chile
Chile
-
 China
China
-
 Colombia
-
 Congo
Congo
-
 Costa Rica
-
 Cote d'Ivoire
-
 Croatia
-
 Cuba
Cuba
-
 Cyprus
-
 Czechia
-
 DR Congo
-
 Denmark
-
 Dominican Republic
-
 Ecuador
-
 Egypt
Egypt
-
 El Salvador
-
 Estonia
-
 Eswatini
-
 Ethiopia
-
 Finland
-
 France
-
 Georgia
-
 Germany
-
 Ghana
Ghana
-
 Greece
-
 Haiti
Haiti
-
 Hong Kong
-
 Hungary
-
 India
India
-
 Indonesia
-
 Iran, Islamic republic
-
 Iraq
Iraq
-
 Ireland
-
 Israel
-
 Italy
Italy
-
 Jamaica
-
 Japan
Japan
-
 Jordan
-
 Kazakhstan
-
 Kenya
Kenya
-
 Korea
Korea
-
 Kuwait
-
 Kyrgyzstan
-
 Laos
Laos
-
 Latvia
-
 Lebanon
-
 Lesotho
-
 Libya
Libya
-
 Lithuania
-
 Luxembourg
-
 Madagascar
-
 Malaysia
-
 Malta
Malta
-
 Mauritius
-
 Mexico
-
 Moldova
-
 Mongolia
-
 Montenegro
-
 Morocco
-
 Mozambique
-
 Myanmar
-
 Namibia
-
 Nepal
Nepal
-
 Netherlands
-
 New Zealand
-
 Nigeria
-
 North Macedonia
-
 Norway
-
 Oman
Oman
-
 Pakistan
-
 Palestine
-
 Panama
-
 Papua New Guinea
-
 Paraguay
-
 Peru
Peru
-
 Philippines
-
 Poland
-
 Portugal
-
 Puerto Rico
-
 Qatar
Qatar
-
 Reunion
-
 Romania
-
 Rwanda
-
 Saudi Arabia
-
 Serbia
-
 Singapore
-
 Slovakia
-
 Slovenia
-
 Somalia
-
 South Africa
-
 Spain
Spain
-
 Sri Lanka
-
 Sweden
-
 Switzerland
-
 Syria
Syria
-
 Taiwan
-
 Tajikistan
-
 Tanzania
-
 Thailand
-
 Trinidad and Tobago
-
 Tunisia
-
 Turkey
-
 UAE
UAE
-
 Uganda
-
 Ukraine
-
 United Kingdom
-
United States
-
 Uruguay
-
 Uzbekistan
-
 Venezuela
-
 Vietnam
-
 Yemen
Yemen
-
 Zambia
-
 Zimbabwe
- Forex
- Crypto
