
Will IOTA avoid deeper losses as sellers dominate session price action?

IOTA (IOTA) is trading at $0.0402, down 7.37% on the day. The asset holds above its short- and medium-term moving averages, while remaining below longer-term trend levels.
 0.0437
0.0437
0.0437
Highlights
- IOTA/USD shows short- and medium-term strength but remains in a longer-term bearish trend below key daily resistance.
- Mixed momentum indicators reveal uncertainty, with intraday sellers dominating despite signals of possible upside reversal.
- Expected range for the next sessions is $0.0384 to $0.042, with a 71% probability of upward movement contingent on breaking $0.0412 resistance.
Mixed technical signals as high volatility meets bearish divergence
On the technical front, IOTA/USD has remained above the MA-20 ($0.0401) and MA-50 ($0.0391) on the H1 chart, but trades below the MA-200 ($0.0638) on the daily timeframe. The Ichimoku Kijun at $0.0412 serves as immediate resistance. Among key indicators, the Moving Average Convergence Divergence (MACD) signals a strong buy while the Average Directional Index (ADX) also suggests continued buy conditions. The Relative Strength Index (RSI) reads 51.26 in buy territory; however, Stochastic RSI shows the asset is oversold and the Commodity Channel Index (CCI) remains neutral. Bull/Bear Power presently indicates seller dominance within the session. The Awesome Oscillator is neutral, providing no clear trend reinforcement. Current volatility is high, with price trading near session lows and bearish divergence noted between indicator momentum and price action.
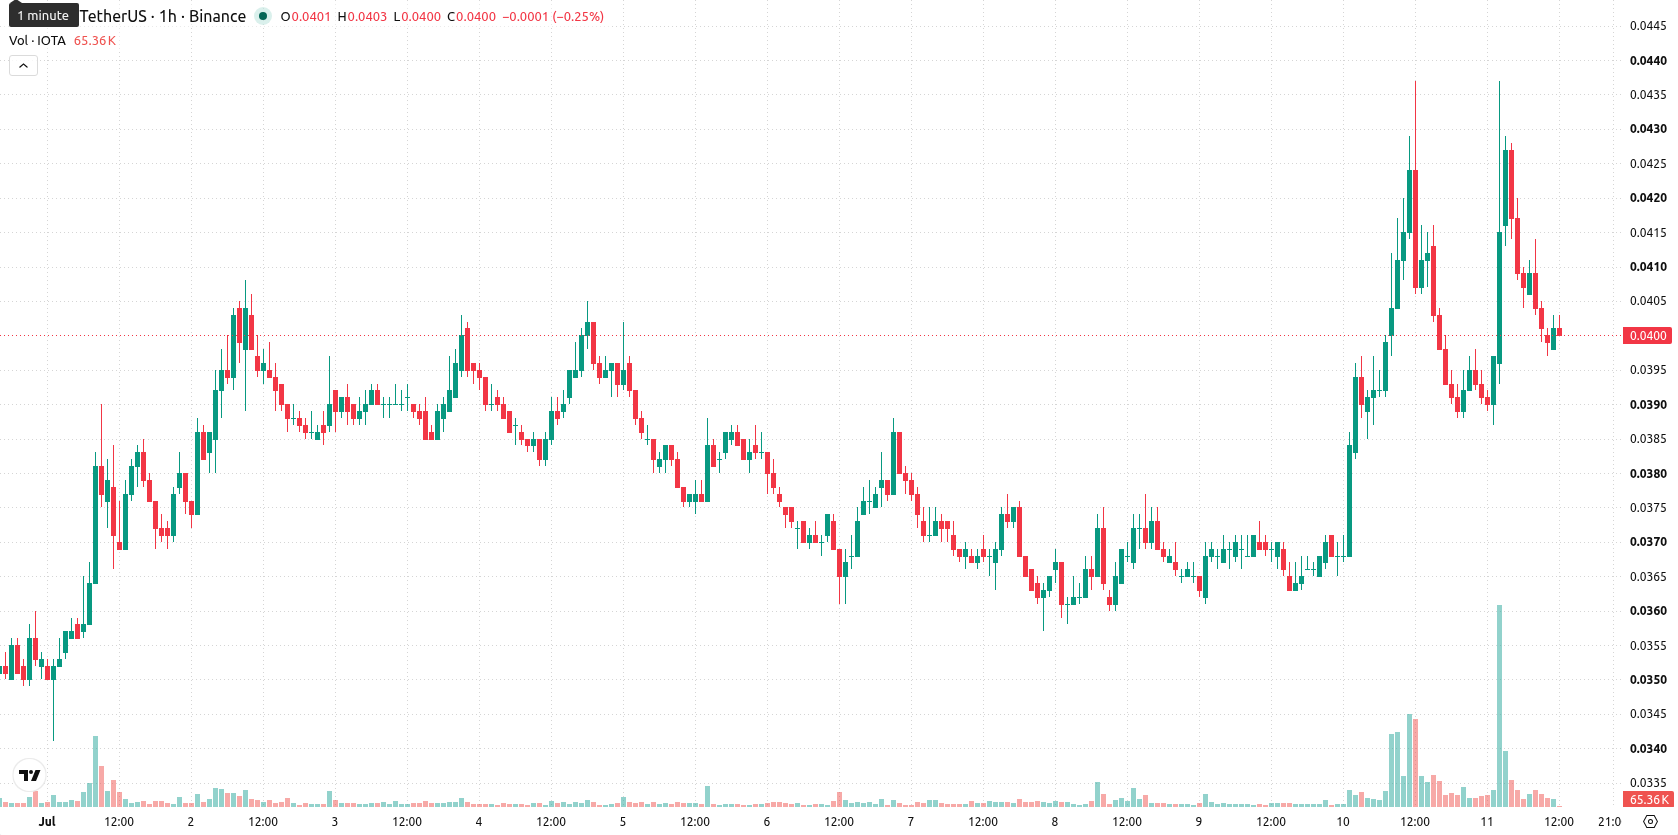
Bullish skew persists as volatility shapes range-bound outlook
Looking ahead, IOTA/USD is forecast to trade within a $0.0384 to $0.042 range over the next trading sessions, reflecting typical volatility for the asset at current levels. The probabilistic scenario assigns a 71% likelihood to upside movement and 29% to further declines, suggesting limited scope for deeper downside in the immediate term. If price breaks decisively above the $0.0412 Ichimoku Kijun resistance, a bullish extension could unfold toward the upper boundary of the projected range. Should support give way, further pullbacks may materialize within the given corridor.
Earlier, analysts noted that IOTA was experiencing a short-term rebound within a persistent broader downtrend. The latest developments add a new dimension, as strengthening short-term bullish signals and a recalibrated probability of upside emphasize $0.0412 as a pivotal level traders should monitor for breakout potential.









-
 Afghanistan
-
 Albania
-
 Algeria
-
 Angola
-
 Argentina
-
 Armenia
-
 Australia
-
 Austria
-
 Azerbaijan
-
 Bahamas
-
 Bahrain
-
 Bangladesh
-
 Belarus
-
 Belgium
-
 Bolivia
-
 Botswana
-
 Brazil
-
 Brunei
-
 Bulgaria
-
 Cambodia
-
 Cameroon
-
 Canada
-
 Chile
Chile
-
 China
China
-
 Colombia
-
 Congo
Congo
-
 Costa Rica
-
 Cote d'Ivoire
-
 Croatia
-
 Cuba
Cuba
-
 Cyprus
-
 Czechia
-
 DR Congo
-
 Denmark
-
 Dominican Republic
-
 Ecuador
-
 Egypt
Egypt
-
 El Salvador
-
 Estonia
-
 Eswatini
-
 Ethiopia
-
 Finland
-
 France
-
 Georgia
-
 Germany
-
 Ghana
Ghana
-
 Greece
-
 Haiti
Haiti
-
 Hong Kong
-
 Hungary
-
 India
India
-
 Indonesia
-
 Iran, Islamic republic
-
 Iraq
Iraq
-
 Ireland
-
 Israel
-
 Italy
Italy
-
 Jamaica
-
 Japan
Japan
-
 Jordan
-
 Kazakhstan
-
 Kenya
Kenya
-
 Korea
Korea
-
 Kuwait
-
 Kyrgyzstan
-
 Laos
Laos
-
 Latvia
-
 Lebanon
-
 Lesotho
-
 Libya
Libya
-
 Lithuania
-
 Luxembourg
-
 Madagascar
-
 Malaysia
-
 Malta
Malta
-
 Mauritius
-
 Mexico
-
 Moldova
-
 Mongolia
-
 Montenegro
-
 Morocco
-
 Mozambique
-
 Myanmar
-
 Namibia
-
 Nepal
Nepal
-
 Netherlands
-
 New Zealand
-
 Nigeria
-
 North Macedonia
-
 Norway
-
 Oman
Oman
-
 Pakistan
-
 Palestine
-
 Panama
-
 Papua New Guinea
-
 Paraguay
-
 Peru
Peru
-
 Philippines
-
 Poland
-
 Portugal
-
 Puerto Rico
-
 Qatar
Qatar
-
 Reunion
-
 Romania
-
 Rwanda
-
 Saudi Arabia
-
 Serbia
-
 Singapore
-
 Slovakia
-
 Slovenia
-
 Somalia
-
 South Africa
-
 Spain
Spain
-
 Sri Lanka
-
 Sweden
-
 Switzerland
-
 Syria
Syria
-
 Taiwan
-
 Tajikistan
-
 Tanzania
-
 Thailand
-
 Trinidad and Tobago
-
 Tunisia
-
 Turkey
-
 UAE
UAE
-
 Uganda
-
 Ukraine
-
 United Kingdom
-
United States
-
 Uruguay
-
 Uzbekistan
-
 Venezuela
-
 Vietnam
-
 Yemen
Yemen
-
 Zambia
-
 Zimbabwe
- Forex
- Crypto











