
Jupiter climbs 7.69% as price remains below short-term average

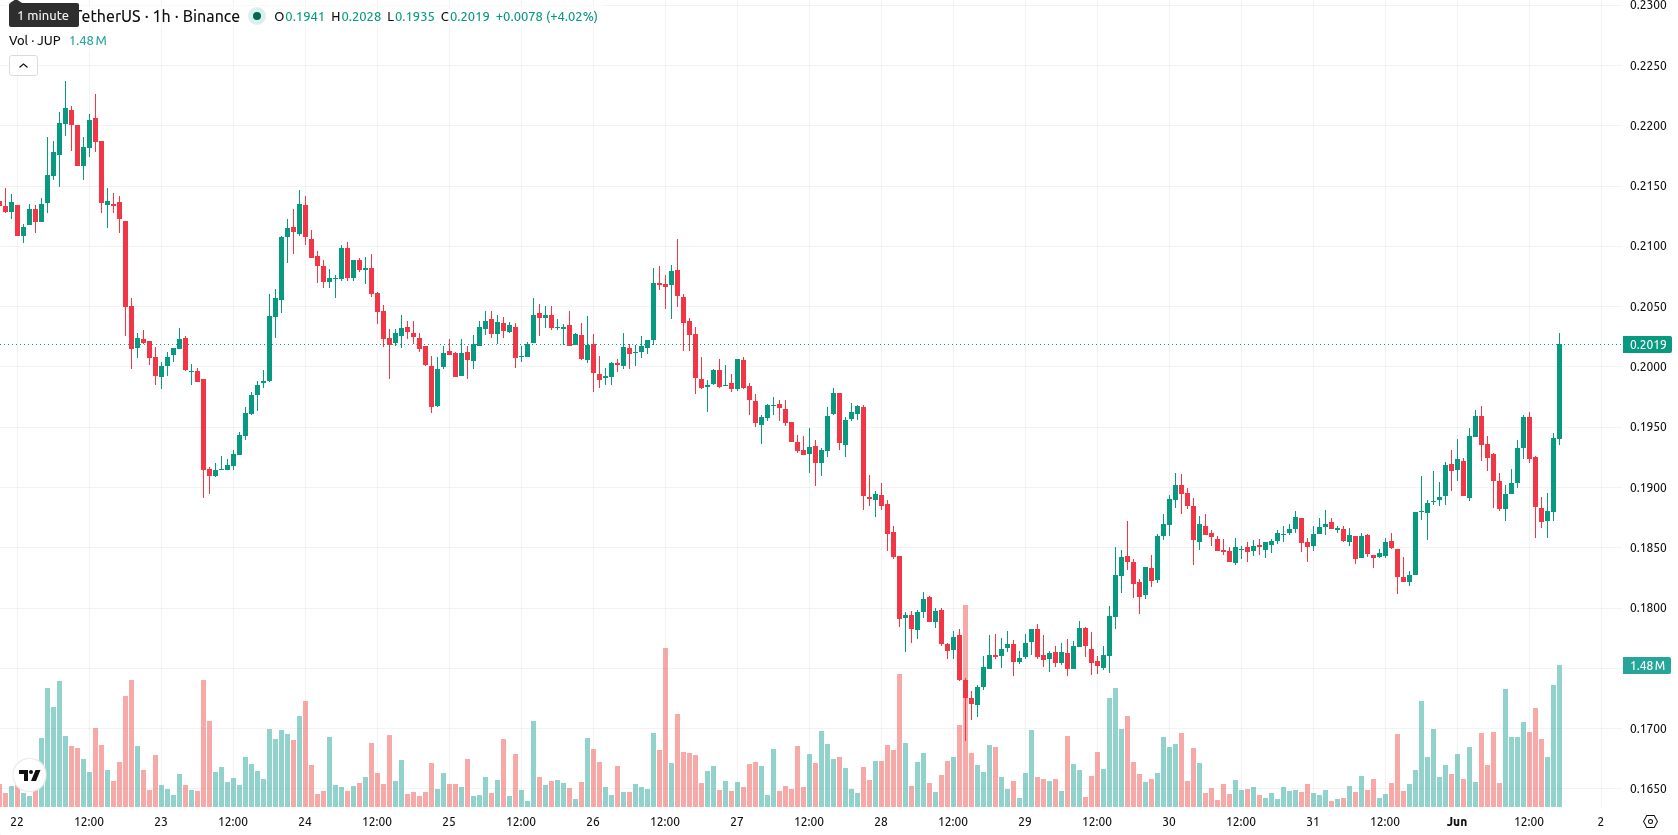
Jupiter (JUP) is trading at $0.2016 after a 7.69% gain today and currently sits just below its key short-term moving average but remains above medium- and long-term averages.
Highlights
- JUP faces short-term seller resistance while retaining medium- and long-term technical support above $0.1927.
- Momentum and trend indicators remain weak or negative, suggesting limited bullish follow-through despite recent intraday gains.
- Price is expected to fluctuate between $0.1910 and $0.2100, with resistance at $0.2228 and a higher probability of downside moves.
Mixed momentum persists as resistance and divergent signals cap rally
JUP is currently trading just below the MA-20 at $0.2023, but remains above the MA-50 ($0.1941) and MA-200 ($0.1927) on the daily chart. The Ichimoku Kijun level at $0.2228 acts as immediate resistance for the session. Technical indicators show that MACD and ADX on the daily timeframe suggest weak or negative momentum, while the RSI is below 50 and the CCI is moderately negative. The BBP remains slightly negative, indicating sellers control intraday action; however, volatility is moderate to high and the price is moving toward session highs. Divergences are present between oscillators, with some showing neutral or overbought conditions while trend and momentum indicators remain bearish, suggesting the rally is not fully confirmed by underlying momentum.
Range-bound price action as overhead resistance and low upside odds persist
Over the next five trading days, JUP is likely to fluctuate within a typical volatility band of $0.1910 to $0.2300, with the probability of further upside moves remaining low (less than 20%). The baseline scenario involves sideways trading between $0.1910 and $0.2100, contained by mixed indicator signals and overhead resistance. An upside scenario would require a convincing break and close above the Kijun resistance at $0.2228, which could open room toward $0.2300. If support near $0.1910 fails, a bearish retracement toward the lower end of the weekly range would become more likely.
Earlier, analysts noted that Jupiter was experiencing persistent bearish momentum despite protocol enhancements and signs of being oversold. The latest price action shows that while short-term rallies are emerging, sustained upside will likely remain limited unless the token can decisively close above the Ichimoku Kijun resistance, making this level a critical threshold for any meaningful trend reversal.


-
 Afghanistan
-
 Albania
-
 Algeria
-
 Angola
-
 Argentina
-
 Armenia
-
 Australia
-
 Austria
-
 Azerbaijan
-
 Bahamas
-
 Bahrain
-
 Bangladesh
-
 Belarus
-
 Belgium
-
 Bolivia
-
 Botswana
-
 Brazil
-
 Brunei
-
 Bulgaria
-
 Cambodia
-
 Cameroon
-
 Canada
-
 Chile
Chile
-
 China
China
-
 Colombia
-
 Congo
Congo
-
 Costa Rica
-
 Cote d'Ivoire
-
 Croatia
-
 Cuba
Cuba
-
 Cyprus
-
 Czechia
-
 DR Congo
-
 Denmark
-
 Dominican Republic
-
 Ecuador
-
 Egypt
Egypt
-
 El Salvador
-
 Estonia
-
 Eswatini
-
 Ethiopia
-
 Finland
-
 France
-
 Georgia
-
 Germany
-
 Ghana
Ghana
-
 Greece
-
 Haiti
Haiti
-
 Hong Kong
-
 Hungary
-
 India
India
-
 Indonesia
-
 Iran, Islamic republic
-
 Iraq
Iraq
-
 Ireland
-
 Israel
-
 Italy
Italy
-
 Jamaica
-
 Japan
Japan
-
 Jordan
-
 Kazakhstan
-
 Kenya
Kenya
-
 Korea
Korea
-
 Kuwait
-
 Kyrgyzstan
-
 Laos
Laos
-
 Latvia
-
 Lebanon
-
 Lesotho
-
 Libya
Libya
-
 Lithuania
-
 Luxembourg
-
 Madagascar
-
 Malaysia
-
 Malta
Malta
-
 Mauritius
-
 Mexico
-
 Moldova
-
 Mongolia
-
 Montenegro
-
 Morocco
-
 Mozambique
-
 Myanmar
-
 Namibia
-
 Nepal
Nepal
-
 Netherlands
-
 New Zealand
-
 Nigeria
-
 North Macedonia
-
 Norway
-
 Oman
Oman
-
 Pakistan
-
 Palestine
-
 Panama
-
 Papua New Guinea
-
 Paraguay
-
 Peru
Peru
-
 Philippines
-
 Poland
-
 Portugal
-
 Puerto Rico
-
 Qatar
Qatar
-
 Reunion
-
 Romania
-
 Rwanda
-
 Saudi Arabia
-
 Serbia
-
 Singapore
-
 Slovakia
-
 Slovenia
-
 Somalia
-
 South Africa
-
 Spain
Spain
-
 Sri Lanka
-
 Sweden
-
 Switzerland
-
 Syria
Syria
-
 Taiwan
-
 Tajikistan
-
 Tanzania
-
 Thailand
-
 Trinidad and Tobago
-
 Tunisia
-
 Turkey
-
 UAE
UAE
-
 Uganda
-
 Ukraine
-
 United Kingdom
-
United States
-
 Uruguay
-
 Uzbekistan
-
 Venezuela
-
 Vietnam
-
 Yemen
Yemen
-
 Zambia
-
 Zimbabwe
- Forex
- Crypto
