
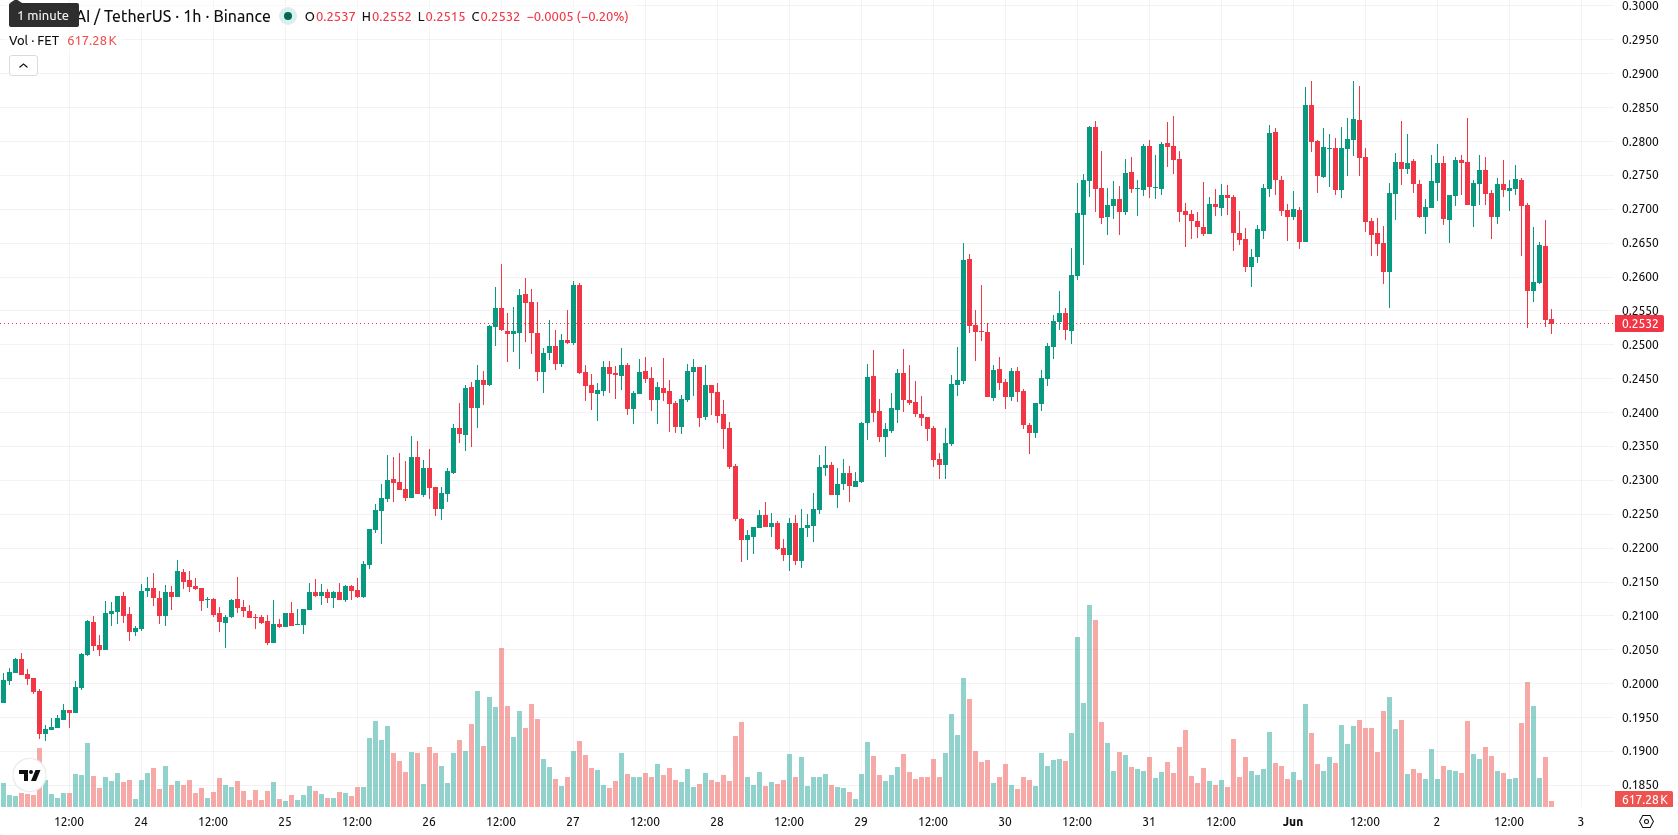
Fetch.ai slides as sellers dominate near daily lows

Fetch.ai (FET) is trading at $0.2535, marking a daily decline of 8.15%. The asset is currently positioned above its key short-, medium-, and long-term moving averages.
Highlights
- FET maintains bullish momentum across short, medium, and long timeframes, trading above key moving averages.
- Overbought signals from multiple oscillators and a sharp intraday decline suggest increasing risk of a short-term pullback.
- The price is expected to consolidate between $0.2300 and $0.2790 over the next five days, with downside risk prevailing.
Overbought signals intensify as bullish momentum faces volatility
FET trades above its SMA-20 ($0.2211), SMA-50 ($0.2184), and SMA-200 ($0.2203) levels, while the Ichimoku Kijun at $0.2368 now acts as immediate support. Momentum on the daily chart is positive, as indicated by an ADX reading of 22.7 (Buy) and a bullish MACD setup. Oscillator signals, however, point to overheating: the RSI stands at 67.4 (near overbought), CCI is deeply overbought at 147.2, and the Stoch RSI is also in deeply overbought territory. BBP remains positive, showing buyer dominance on an intraday basis, while the Awesome Oscillator also favors the uptrend. Today's price action brought FET close to its daily low, highlighting increased volatility and acute selling pressure after the open—an environment where overbought momentum signals now diverge from broader bullish trends.
Range-bound scenario likely as overbought risks hinder upside
Over the next five trading days, FET is expected to fluctuate between $0.2300 and $0.2790, a volatility band reflective of recent price swings. The probability of a further price increase is low (less than 20%), so a pullback or range-bound activity is the more likely scenario. The baseline sees consolidation between $0.2300 and $0.2790, while a sustained break above $0.2790 could invite additional gains if buyers return. Alternatively, a move below $0.2300 would indicate renewed downside, especially while oscillators remain overbought in the short term.
Earlier, analysts noted that while Fetch.ai exhibited strong bullish momentum, the risk of near-term consolidation was elevated due to overbought technical signals. With fresh volatility and intensified overbought readings now diverging from the broader trend, traders should focus on potential shifts in momentum if FET sustains a move outside its current $0.2300–$0.2790 consolidation band.


Latest FET News


-
 Afghanistan
-
 Albania
-
 Algeria
-
 Angola
-
 Argentina
-
 Armenia
-
 Australia
-
 Austria
-
 Azerbaijan
-
 Bahamas
-
 Bahrain
-
 Bangladesh
-
 Belarus
-
 Belgium
-
 Bolivia
-
 Botswana
-
 Brazil
-
 Brunei
-
 Bulgaria
-
 Cambodia
-
 Cameroon
-
 Canada
-
 Chile
Chile
-
 China
China
-
 Colombia
-
 Congo
Congo
-
 Costa Rica
-
 Cote d'Ivoire
-
 Croatia
-
 Cuba
Cuba
-
 Cyprus
-
 Czechia
-
 DR Congo
-
 Denmark
-
 Dominican Republic
-
 Ecuador
-
 Egypt
Egypt
-
 El Salvador
-
 Estonia
-
 Eswatini
-
 Ethiopia
-
 Finland
-
 France
-
 Georgia
-
 Germany
-
 Ghana
Ghana
-
 Greece
-
 Haiti
Haiti
-
 Hong Kong
-
 Hungary
-
 India
India
-
 Indonesia
-
 Iran, Islamic republic
-
 Iraq
Iraq
-
 Ireland
-
 Israel
-
 Italy
Italy
-
 Jamaica
-
 Japan
Japan
-
 Jordan
-
 Kazakhstan
-
 Kenya
Kenya
-
 Korea
Korea
-
 Kuwait
-
 Kyrgyzstan
-
 Laos
Laos
-
 Latvia
-
 Lebanon
-
 Lesotho
-
 Libya
Libya
-
 Lithuania
-
 Luxembourg
-
 Madagascar
-
 Malaysia
-
 Malta
Malta
-
 Mauritius
-
 Mexico
-
 Moldova
-
 Mongolia
-
 Montenegro
-
 Morocco
-
 Mozambique
-
 Myanmar
-
 Namibia
-
 Nepal
Nepal
-
 Netherlands
-
 New Zealand
-
 Nigeria
-
 North Macedonia
-
 Norway
-
 Oman
Oman
-
 Pakistan
-
 Palestine
-
 Panama
-
 Papua New Guinea
-
 Paraguay
-
 Peru
Peru
-
 Philippines
-
 Poland
-
 Portugal
-
 Puerto Rico
-
 Qatar
Qatar
-
 Reunion
-
 Romania
-
 Rwanda
-
 Saudi Arabia
-
 Serbia
-
 Singapore
-
 Slovakia
-
 Slovenia
-
 Somalia
-
 South Africa
-
 Spain
Spain
-
 Sri Lanka
-
 Sweden
-
 Switzerland
-
 Syria
Syria
-
 Taiwan
-
 Tajikistan
-
 Tanzania
-
 Thailand
-
 Trinidad and Tobago
-
 Tunisia
-
 Turkey
-
 UAE
UAE
-
 Uganda
-
 Ukraine
-
 United Kingdom
-
United States
-
 Uruguay
-
 Uzbekistan
-
 Venezuela
-
 Vietnam
-
 Yemen
Yemen
-
 Zambia
-
 Zimbabwe
- Forex
- Crypto
