
Bitcoin price prediction: Will $59,925.74–$67,998.28 range hold as BTC slips 5%?

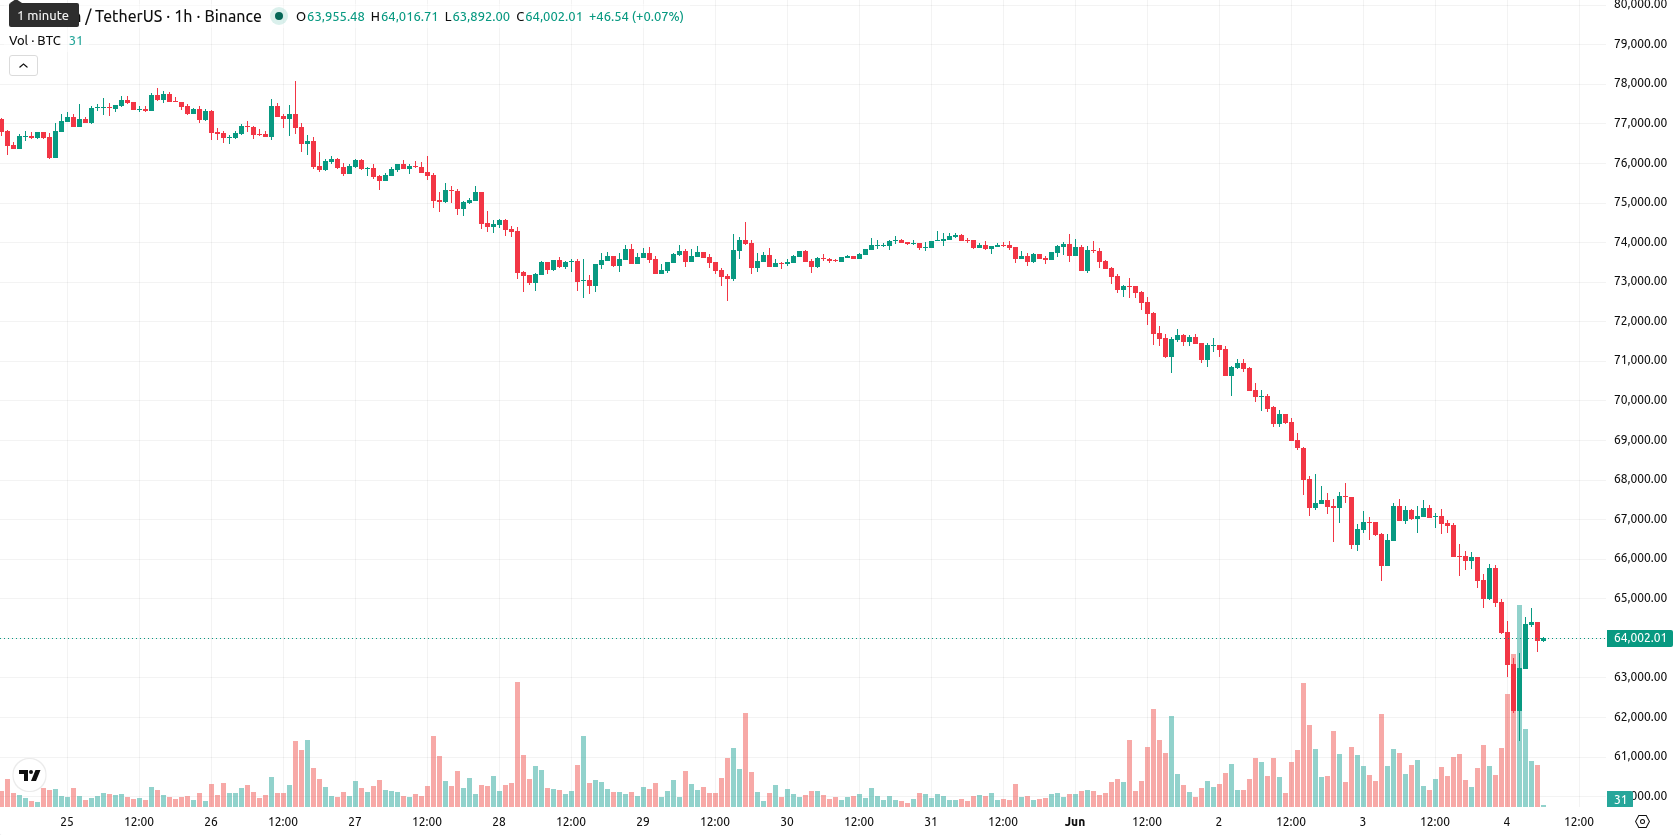
Bitcoin (BTC) is trading at $63,962.01, down 5.00% on the day. The asset is currently positioned below its key moving averages, reflecting pronounced short-term and medium-term weakness.
Highlights
- U.S. spot Bitcoin ETFs saw $519 million in net outflows and $1.86 billion in forced liquidations over twelve straight days, pressuring prices lower.
- Treasury sales by Strategy and limited offsetting accumulation failed to counter the increased Bitcoin market supply from ETF redemptions.
- Technical signals remain bearish with Bitcoin trading below key moving averages, and downside risk dominates the expected $59,925.74–$67,998.28 price range.
ETF outflows and forced sales accelerate supply amid liquidation cycle
U.S. spot Bitcoin ETFs underwent their twelfth consecutive day of net redemptions, totaling $519 million and producing $1.86 billion in forced sales from leveraged market participants as of June 3, 2026. This cycle of outflows directly raised market supply, intensifying downward pressure on Bitcoin through liquidations and diminished institutional demand. Separately, Strategy’s sale of 32 BTC raised approximately $2.5 million for preferred stock distributions, marking its first treasury reduction since 2022 and contributing to broader supply. Additional accumulation efforts by Strive Asset Management and the U.S. Treasury’s ongoing reserve strategy offered limited offset amid prevailing liquidation forces.
Bearish momentum confirmed as resistance aligns with broad technical weakness
BTC/USD is positioned below the MA-20 ($65,458.01) and MA-50 ($67,042.87) on the hourly chart, and substantially beneath the MA-200 ($79,122.42) on the daily timeframe. The Ichimoku Kijun at $64,491.34 now acts as immediate resistance. On the indicator front, both MACD and ADX display strong Sell signals, while RSI stands at 40.71 (Sell), CCI continues to point to downside risk, and Stoch RSI is Overbought, suggesting a chance of a short-term rebound even as weakness persists. BBP’s Overbought status underlines near-term buyer activity, but overall oscillator and momentum divergence favours continued bearish conditions.
Volatility expected as tight range limits probability of sustained rally
Over the next 2–3 trading days, BTC/USD is expected to remain volatile within a range of $59,925.74 to $67,998.28, as typical for the current environment. A move above $64,491.34 would be required to shift momentum in favour of a bullish scenario. In contrast, a decline below $59,925.74 could trigger further downside, with the probability of a sustained rally considered very low given present market dynamics.
Earlier, analysts noted that Bitcoin’s declines were being driven by sustained institutional outflows and intensified liquidation pressures, reflecting a shift in market structure. The latest data reinforces this bearish momentum, with persistent ETF redemptions and forced sales suggesting that the next decisive move will depend on whether BTC can reclaim the $64,491 resistance or risks further downside if $59,925 support fails.


Latest Bitcoin News


-
 Afghanistan
-
 Albania
-
 Algeria
-
 Angola
-
 Argentina
-
 Armenia
-
 Australia
-
 Austria
-
 Azerbaijan
-
 Bahamas
-
 Bahrain
-
 Bangladesh
-
 Belarus
-
 Belgium
-
 Bolivia
-
 Botswana
-
 Brazil
-
 Brunei
-
 Bulgaria
-
 Cambodia
-
 Cameroon
-
 Canada
-
 Chile
Chile
-
 China
China
-
 Colombia
-
 Congo
Congo
-
 Costa Rica
-
 Cote d'Ivoire
-
 Croatia
-
 Cuba
Cuba
-
 Cyprus
-
 Czechia
-
 DR Congo
-
 Denmark
-
 Dominican Republic
-
 Ecuador
-
 Egypt
Egypt
-
 El Salvador
-
 Estonia
-
 Eswatini
-
 Ethiopia
-
 Finland
-
 France
-
 Georgia
-
 Germany
-
 Ghana
Ghana
-
 Greece
-
 Haiti
Haiti
-
 Hong Kong
-
 Hungary
-
 India
India
-
 Indonesia
-
 Iran, Islamic republic
-
 Iraq
Iraq
-
 Ireland
-
 Israel
-
 Italy
Italy
-
 Jamaica
-
 Japan
Japan
-
 Jordan
-
 Kazakhstan
-
 Kenya
Kenya
-
 Korea
Korea
-
 Kuwait
-
 Kyrgyzstan
-
 Laos
Laos
-
 Latvia
-
 Lebanon
-
 Lesotho
-
 Libya
Libya
-
 Lithuania
-
 Luxembourg
-
 Madagascar
-
 Malaysia
-
 Malta
Malta
-
 Mauritius
-
 Mexico
-
 Moldova
-
 Mongolia
-
 Montenegro
-
 Morocco
-
 Mozambique
-
 Myanmar
-
 Namibia
-
 Nepal
Nepal
-
 Netherlands
-
 New Zealand
-
 Nigeria
-
 North Macedonia
-
 Norway
-
 Oman
Oman
-
 Pakistan
-
 Palestine
-
 Panama
-
 Papua New Guinea
-
 Paraguay
-
 Peru
Peru
-
 Philippines
-
 Poland
-
 Portugal
-
 Puerto Rico
-
 Qatar
Qatar
-
 Reunion
-
 Romania
-
 Rwanda
-
 Saudi Arabia
-
 Serbia
-
 Singapore
-
 Slovakia
-
 Slovenia
-
 Somalia
-
 South Africa
-
 Spain
Spain
-
 Sri Lanka
-
 Sweden
-
 Switzerland
-
 Syria
Syria
-
 Taiwan
-
 Tajikistan
-
 Tanzania
-
 Thailand
-
 Trinidad and Tobago
-
 Tunisia
-
 Turkey
-
 UAE
UAE
-
 Uganda
-
 Ukraine
-
 United Kingdom
-
United States
-
 Uruguay
-
 Uzbekistan
-
 Venezuela
-
 Vietnam
-
 Yemen
Yemen
-
 Zambia
-
 Zimbabwe
- Forex
- Crypto
