
Bitcoin drops as Iranian strikes in Kuwait and Strait of Hormuz fuel risk concerns

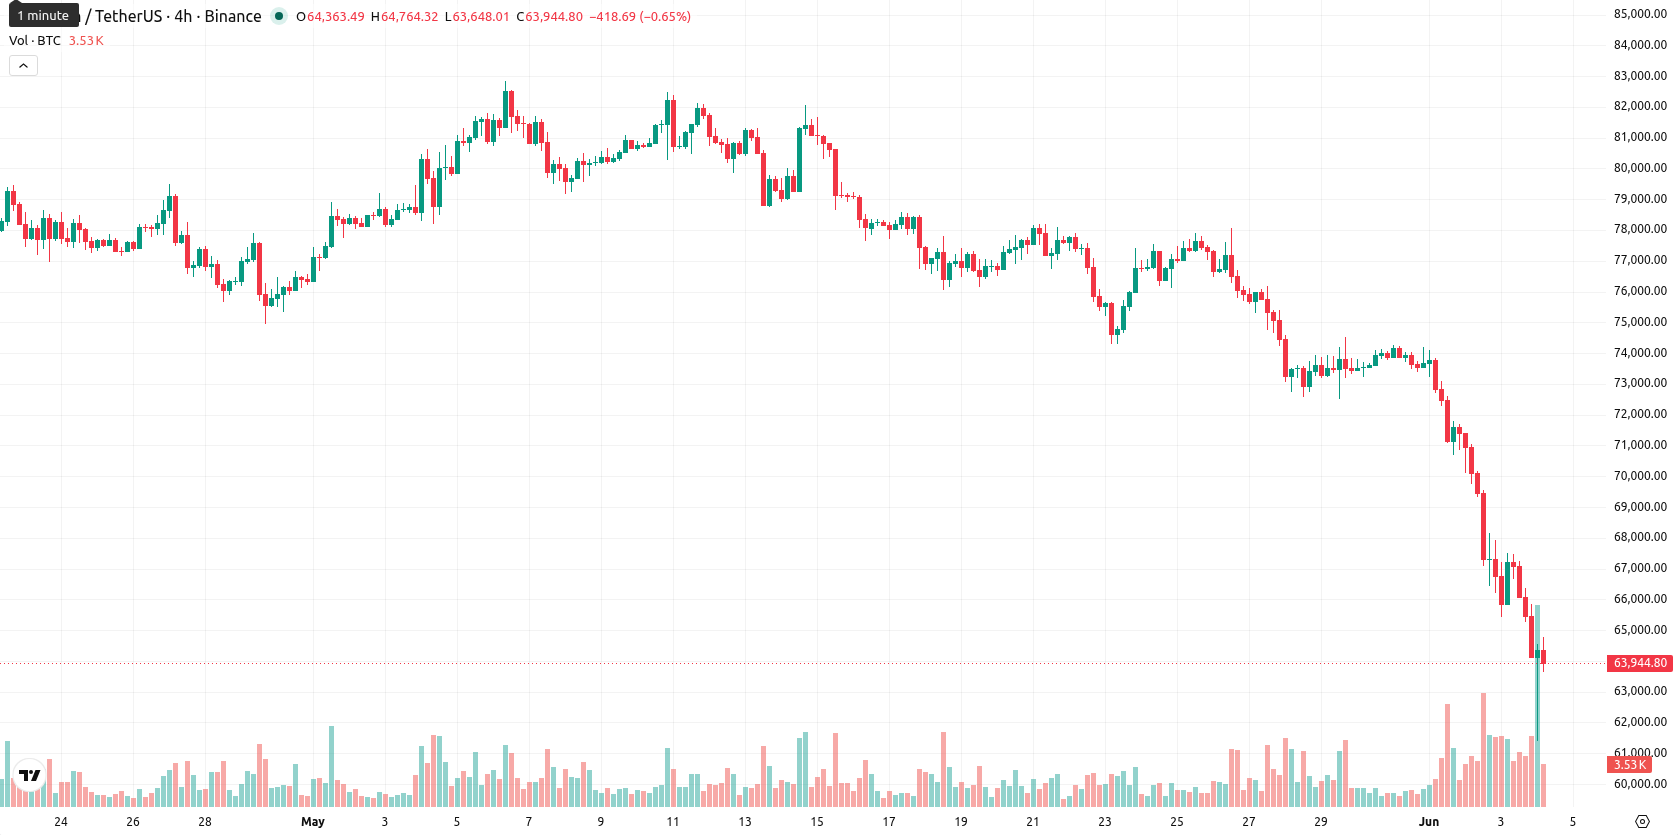
Bitcoin (BTC) is trading at $64,094.01, down 4.42% on the day. The asset is positioned below its key moving averages, reflecting a continuation of short-term and long-term downside momentum.
Highlights
- Over $700 million in leveraged Bitcoin long positions were rapidly liquidated following Iranian strikes and capital outflows, driving intense market deleveraging.
- U.S. Treasury sanctions targeting Iran-based crypto exchanges and executives heightened regulatory risks, coinciding with record $3.4 billion redemptions from U.S. spot Bitcoin ETFs.
- BTC/USD trades below key technical averages with strong downside momentum; technicals point to a high-probability bearish bias in the $60,057.74–$68,130.28 range over the next several days.
Forced deleveraging and ETF outflows as geopolitical and regulatory shocks hit
On June 3, Iranian strikes on Kuwait’s international airport and intensifying conflict in the Strait of Hormuz led to forced liquidation of over $700 million in leveraged Bitcoin long positions, driving rapid deleveraging in the market. The U.S. Treasury Department imposed new sanctions on Iran's largest crypto exchange, Nobitex, and three other Iran-based platforms for sanction evasion and terror financing, explicitly targeting exchange executives and heightening regulatory risks for Bitcoin-related transactions. These developments were compounded by record redemption activity exceeding $3.4 billion in U.S. spot Bitcoin ETFs, as large Bitcoin transfers out of custodial wallets followed hawkish Federal Reserve communications and contributed to institutional outflows.
Strong sell momentum as BTC tests resistance amid mixed indicators
BTC is trading beneath the MA-20 at $65,316.62 and MA-50 at $66,908.74 on the working timeframe, sitting well below the long-term MA-200 at $79,122.42. The immediate resistance is defined by the Ichimoku Kijun level at $64,491.34. On the indicator front, both MACD and ADX are generating strong sell signals, while RSI and CCI remain negative. Stoch RSI now signals overbought, whereas BBP indicates market conditions are oversold with sellers maintaining control. AO remains neutral, reflecting conflicting signals among short-term oscillators.
Downside scenario prevails as breakout odds diminish
In the short-term, BTC/USD is projected to trade within a volatility band of $60,057.74 to $68,130.28 over the next 2–3 sessions. The probability of an upward breakout is considered very low, while further downside momentum has a very high likelihood, limiting chances of a reversal. The baseline scenario sees price consolidating sideways, with a bullish case requiring a sustained move above $64,491.34 resistance, and the bearish scenario involving a decisive move lower towards the base of the current range.
Earlier, analysts noted that persistent institutional outflows and forced liquidations were establishing a bearish momentum for Bitcoin. The latest escalation in geopolitical tensions and regulatory sanctions has further intensified downward pressure, making the $64,491.34 resistance a crucial threshold for any potential shift in market sentiment.


Latest Bitcoin News


-
 Afghanistan
-
 Albania
-
 Algeria
-
 Angola
-
 Argentina
-
 Armenia
-
 Australia
-
 Austria
-
 Azerbaijan
-
 Bahamas
-
 Bahrain
-
 Bangladesh
-
 Belarus
-
 Belgium
-
 Bolivia
-
 Botswana
-
 Brazil
-
 Brunei
-
 Bulgaria
-
 Cambodia
-
 Cameroon
-
 Canada
-
 Chile
Chile
-
 China
China
-
 Colombia
-
 Congo
Congo
-
 Costa Rica
-
 Cote d'Ivoire
-
 Croatia
-
 Cuba
Cuba
-
 Cyprus
-
 Czechia
-
 DR Congo
-
 Denmark
-
 Dominican Republic
-
 Ecuador
-
 Egypt
Egypt
-
 El Salvador
-
 Estonia
-
 Eswatini
-
 Ethiopia
-
 Finland
-
 France
-
 Georgia
-
 Germany
-
 Ghana
Ghana
-
 Greece
-
 Haiti
Haiti
-
 Hong Kong
-
 Hungary
-
 India
India
-
 Indonesia
-
 Iran, Islamic republic
-
 Iraq
Iraq
-
 Ireland
-
 Israel
-
 Italy
Italy
-
 Jamaica
-
 Japan
Japan
-
 Jordan
-
 Kazakhstan
-
 Kenya
Kenya
-
 Korea
Korea
-
 Kuwait
-
 Kyrgyzstan
-
 Laos
Laos
-
 Latvia
-
 Lebanon
-
 Lesotho
-
 Libya
Libya
-
 Lithuania
-
 Luxembourg
-
 Madagascar
-
 Malaysia
-
 Malta
Malta
-
 Mauritius
-
 Mexico
-
 Moldova
-
 Mongolia
-
 Montenegro
-
 Morocco
-
 Mozambique
-
 Myanmar
-
 Namibia
-
 Nepal
Nepal
-
 Netherlands
-
 New Zealand
-
 Nigeria
-
 North Macedonia
-
 Norway
-
 Oman
Oman
-
 Pakistan
-
 Palestine
-
 Panama
-
 Papua New Guinea
-
 Paraguay
-
 Peru
Peru
-
 Philippines
-
 Poland
-
 Portugal
-
 Puerto Rico
-
 Qatar
Qatar
-
 Reunion
-
 Romania
-
 Rwanda
-
 Saudi Arabia
-
 Serbia
-
 Singapore
-
 Slovakia
-
 Slovenia
-
 Somalia
-
 South Africa
-
 Spain
Spain
-
 Sri Lanka
-
 Sweden
-
 Switzerland
-
 Syria
Syria
-
 Taiwan
-
 Tajikistan
-
 Tanzania
-
 Thailand
-
 Trinidad and Tobago
-
 Tunisia
-
 Turkey
-
 UAE
UAE
-
 Uganda
-
 Ukraine
-
 United Kingdom
-
United States
-
 Uruguay
-
 Uzbekistan
-
 Venezuela
-
 Vietnam
-
 Yemen
Yemen
-
 Zambia
-
 Zimbabwe
- Forex
- Crypto
