
-9.94% for IOTA as bearish pressure holds price under $0.0500 resistance

IOTA (IOTA) is trading at $0.0478, down 9.94% for the day. The price has extended losses and is currently positioned below its key moving averages, reflecting persistent downward market pressure.
Highlights
- IOTA/USD faces persistent bearish momentum, with price trading well below key moving averages across all time frames.
- Most momentum indicators align with a strong sell bias, despite short-term oscillators hinting at a possible brief rebound.
- Projected trading range over the next few sessions is $0.0430 to $0.0547, with downside risk prevailing and a bullish reversal appearing unlikely.
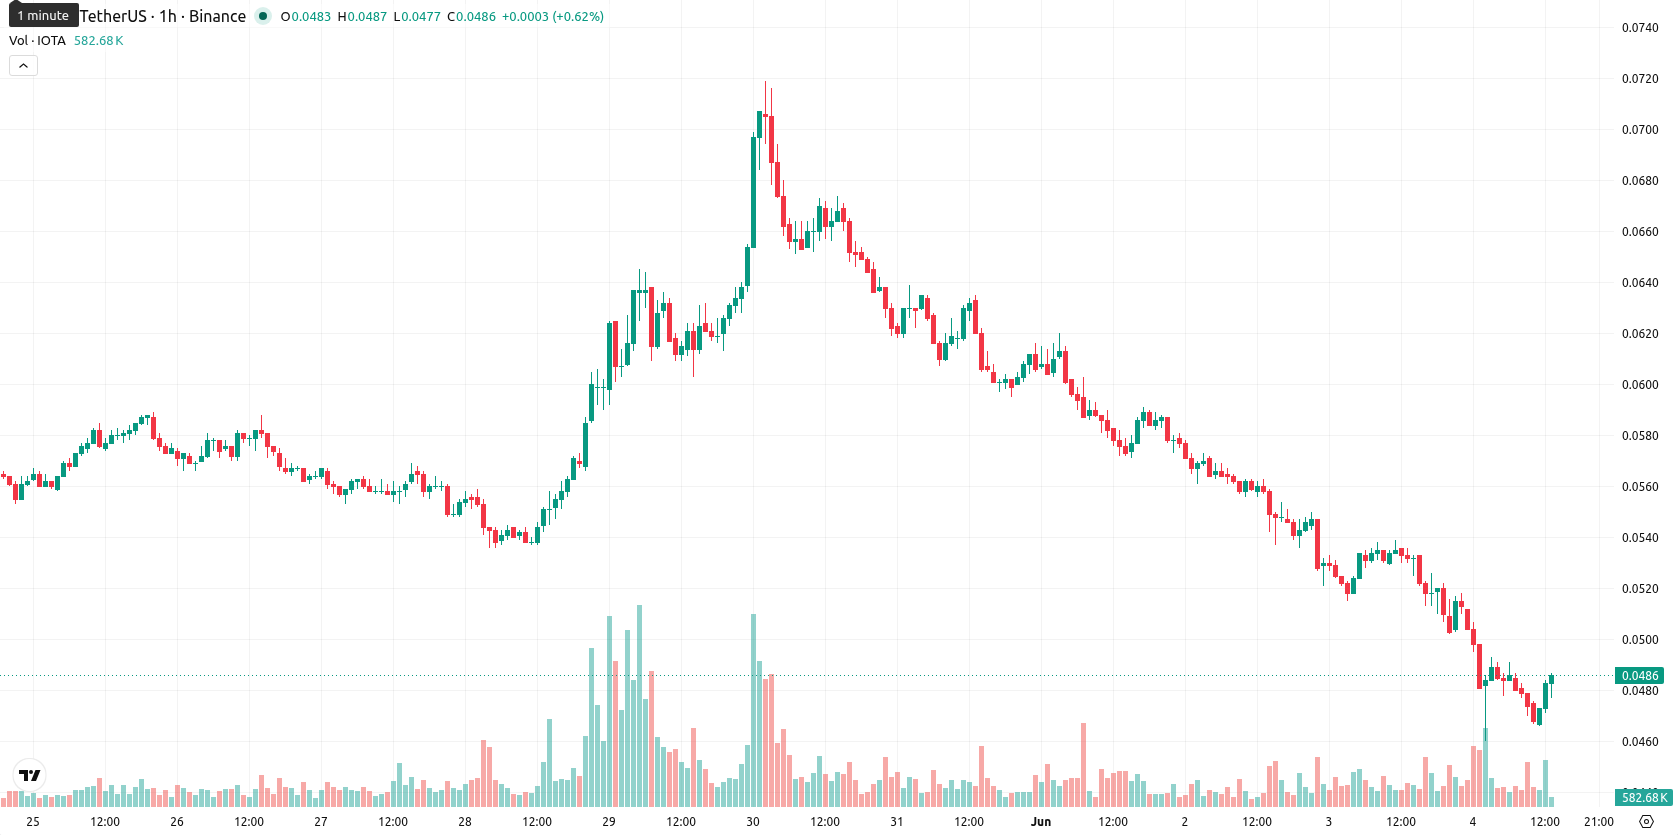
Bearish momentum confirmed as price tests oversold zone
On the hourly chart, IOTA/USD is trading below the MA-20 at $0.0519 and the MA-50 at $0.0538, as well as remaining well under the long-term MA-200 at $0.0756. The Ichimoku Kijun sits at $0.0500, acting as immediate resistance. Momentum indicators are aligned with the bearish setup: MACD, ADX, and Bull/Bear Power (BBP) confirm strong seller dominance. RSI is in the oversold zone at 32.92, while CCI also signals oversold conditions. Although Stoch RSI issues a strong buy signal suggestive of a short-term rebound, this is a divergent signal within the broader bearish momentum. The Awesome Oscillator also supports the prevailing downward trend. The price is near the daily low with high intraday volatility and a negative gap of $0.0045.
Downside risks persist amid constrained rebound potential
Over the next two to three sessions, IOTA/USD is expected to trade within a typical volatility band of $0.0430 to $0.0547. The probability of a move higher remains very low, while downward continuation is favored in the short term. Sideways activity within this range is considered the baseline scenario. A break above the Ichimoku Kijun at $0.0500 would open the door to further upside, whereas price action below $0.0430 could reinforce bearish momentum.
Earlier, analysts noted that IOTA was experiencing persistent downside pressure amid conflicting momentum signals and heightened technical uncertainty. The latest developments reinforce this bearish outlook, with sustained weakness putting increased focus on whether the $0.0430 support will hold in the coming sessions.


-
 Afghanistan
-
 Albania
-
 Algeria
-
 Angola
-
 Argentina
-
 Armenia
-
 Australia
-
 Austria
-
 Azerbaijan
-
 Bahamas
-
 Bahrain
-
 Bangladesh
-
 Belarus
-
 Belgium
-
 Bolivia
-
 Botswana
-
 Brazil
-
 Brunei
-
 Bulgaria
-
 Cambodia
-
 Cameroon
-
 Canada
-
 Chile
Chile
-
 China
China
-
 Colombia
-
 Congo
Congo
-
 Costa Rica
-
 Cote d'Ivoire
-
 Croatia
-
 Cuba
Cuba
-
 Cyprus
-
 Czechia
-
 DR Congo
-
 Denmark
-
 Dominican Republic
-
 Ecuador
-
 Egypt
Egypt
-
 El Salvador
-
 Estonia
-
 Eswatini
-
 Ethiopia
-
 Finland
-
 France
-
 Georgia
-
 Germany
-
 Ghana
Ghana
-
 Greece
-
 Haiti
Haiti
-
 Hong Kong
-
 Hungary
-
 India
India
-
 Indonesia
-
 Iran, Islamic republic
-
 Iraq
Iraq
-
 Ireland
-
 Israel
-
 Italy
Italy
-
 Jamaica
-
 Japan
Japan
-
 Jordan
-
 Kazakhstan
-
 Kenya
Kenya
-
 Korea
Korea
-
 Kuwait
-
 Kyrgyzstan
-
 Laos
Laos
-
 Latvia
-
 Lebanon
-
 Lesotho
-
 Libya
Libya
-
 Lithuania
-
 Luxembourg
-
 Madagascar
-
 Malaysia
-
 Malta
Malta
-
 Mauritius
-
 Mexico
-
 Moldova
-
 Mongolia
-
 Montenegro
-
 Morocco
-
 Mozambique
-
 Myanmar
-
 Namibia
-
 Nepal
Nepal
-
 Netherlands
-
 New Zealand
-
 Nigeria
-
 North Macedonia
-
 Norway
-
 Oman
Oman
-
 Pakistan
-
 Palestine
-
 Panama
-
 Papua New Guinea
-
 Paraguay
-
 Peru
Peru
-
 Philippines
-
 Poland
-
 Portugal
-
 Puerto Rico
-
 Qatar
Qatar
-
 Reunion
-
 Romania
-
 Rwanda
-
 Saudi Arabia
-
 Serbia
-
 Singapore
-
 Slovakia
-
 Slovenia
-
 Somalia
-
 South Africa
-
 Spain
Spain
-
 Sri Lanka
-
 Sweden
-
 Switzerland
-
 Syria
Syria
-
 Taiwan
-
 Tajikistan
-
 Tanzania
-
 Thailand
-
 Trinidad and Tobago
-
 Tunisia
-
 Turkey
-
 UAE
UAE
-
 Uganda
-
 Ukraine
-
 United Kingdom
-
United States
-
 Uruguay
-
 Uzbekistan
-
 Venezuela
-
 Vietnam
-
 Yemen
Yemen
-
 Zambia
-
 Zimbabwe
- Forex
- Crypto
