
-7.20% for IOTA as volatility stays high with further downside risk

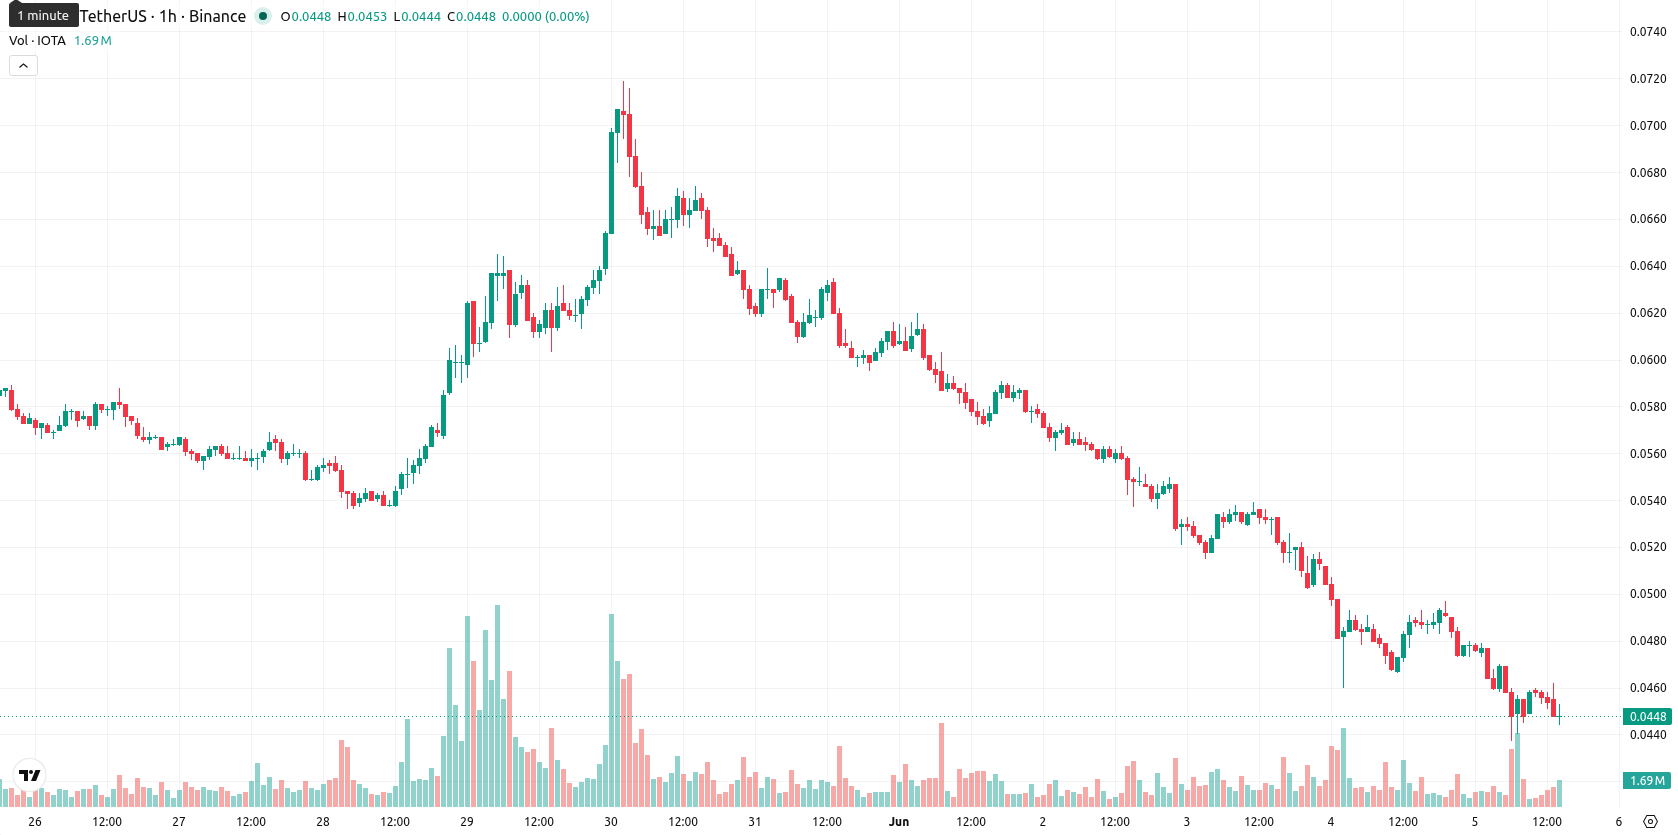
IOTA (IOTA) is trading at $0.0451, marking a daily decline of 7.20%. The asset has moved lower on the day and is currently sitting below its key moving averages, reflecting significant downward pressure.
Highlights
- IOTA/USD continues to face strong selling pressure, trading below major moving averages and showing pronounced downward momentum.
- Technical indicators overwhelmingly signal a bearish outlook, confirmed by negative momentum readings and only brief buyer activity amid overall weakness.
- Price is projected to trade between $0.0393 and $0.0519 over the next 2–3 days, with significant risk of further decline if support breaks.
Bearish momentum confirmed despite isolated technical divergences
IOTA/USD is trading below its MA-20 at $0.0466 and MA-50 at $0.0486, confirming continued short- and medium-term weakness. The price also sits significantly under the daily MA-200 at $0.0752, while the Ichimoku Kijun level at $0.0468 acts as the nearest resistance. On the momentum side, the MACD gives a strong sell reading, ADX signals a sell, and RSI is at 38.38 (Sell). The CCI also indicates a sell signal, while Stoch RSI stands out as overbought, diverging from the other indicators. Bull/Bear Power (BBP) is the only technical suggesting near-term buyer strength, but the broader indicator set confirms persistent bearish momentum and heightened volatility.
Downward risk prevails as volatility drives price range
In the near term, IOTA is expected to move within a range of $0.0393 to $0.0519, reflecting a volatility band consistent with recent price action. The probability of a move lower remains much higher than that of a reversal to the upside. A sideways movement within this band forms the baseline scenario. Should IOTA break above the $0.0468 resistance, a recovery scenario could unfold; conversely, failure to hold support at the lower end may lead to accelerated losses toward the $0.0393 level.
Earlier, analysts noted that IOTA was experiencing persistent downside pressure amid sustained bearish momentum. The current analysis not only confirms but intensifies this outlook, with expanded volatility and technical weakness highlighting the importance of monitoring the $0.0393 support as the next potential downside risk.


-
 Afghanistan
-
 Albania
-
 Algeria
-
 Angola
-
 Argentina
-
 Armenia
-
 Australia
-
 Austria
-
 Azerbaijan
-
 Bahamas
-
 Bahrain
-
 Bangladesh
-
 Belarus
-
 Belgium
-
 Bolivia
-
 Botswana
-
 Brazil
-
 Brunei
-
 Bulgaria
-
 Cambodia
-
 Cameroon
-
 Canada
-
 Chile
Chile
-
 China
China
-
 Colombia
-
 Congo
Congo
-
 Costa Rica
-
 Cote d'Ivoire
-
 Croatia
-
 Cuba
Cuba
-
 Cyprus
-
 Czechia
-
 DR Congo
-
 Denmark
-
 Dominican Republic
-
 Ecuador
-
 Egypt
Egypt
-
 El Salvador
-
 Estonia
-
 Eswatini
-
 Ethiopia
-
 Finland
-
 France
-
 Georgia
-
 Germany
-
 Ghana
Ghana
-
 Greece
-
 Haiti
Haiti
-
 Hong Kong
-
 Hungary
-
 India
India
-
 Indonesia
-
 Iran, Islamic republic
-
 Iraq
Iraq
-
 Ireland
-
 Israel
-
 Italy
Italy
-
 Jamaica
-
 Japan
Japan
-
 Jordan
-
 Kazakhstan
-
 Kenya
Kenya
-
 Korea
Korea
-
 Kuwait
-
 Kyrgyzstan
-
 Laos
Laos
-
 Latvia
-
 Lebanon
-
 Lesotho
-
 Libya
Libya
-
 Lithuania
-
 Luxembourg
-
 Madagascar
-
 Malaysia
-
 Malta
Malta
-
 Mauritius
-
 Mexico
-
 Moldova
-
 Mongolia
-
 Montenegro
-
 Morocco
-
 Mozambique
-
 Myanmar
-
 Namibia
-
 Nepal
Nepal
-
 Netherlands
-
 New Zealand
-
 Nigeria
-
 North Macedonia
-
 Norway
-
 Oman
Oman
-
 Pakistan
-
 Palestine
-
 Panama
-
 Papua New Guinea
-
 Paraguay
-
 Peru
Peru
-
 Philippines
-
 Poland
-
 Portugal
-
 Puerto Rico
-
 Qatar
Qatar
-
 Reunion
-
 Romania
-
 Rwanda
-
 Saudi Arabia
-
 Serbia
-
 Singapore
-
 Slovakia
-
 Slovenia
-
 Somalia
-
 South Africa
-
 Spain
Spain
-
 Sri Lanka
-
 Sweden
-
 Switzerland
-
 Syria
Syria
-
 Taiwan
-
 Tajikistan
-
 Tanzania
-
 Thailand
-
 Trinidad and Tobago
-
 Tunisia
-
 Turkey
-
 UAE
UAE
-
 Uganda
-
 Ukraine
-
 United Kingdom
-
United States
-
 Uruguay
-
 Uzbekistan
-
 Venezuela
-
 Vietnam
-
 Yemen
Yemen
-
 Zambia
-
 Zimbabwe
- Forex
- Crypto
