
Sandbox climbs 2.55% as short-term uptrend extends above $0.0508 support

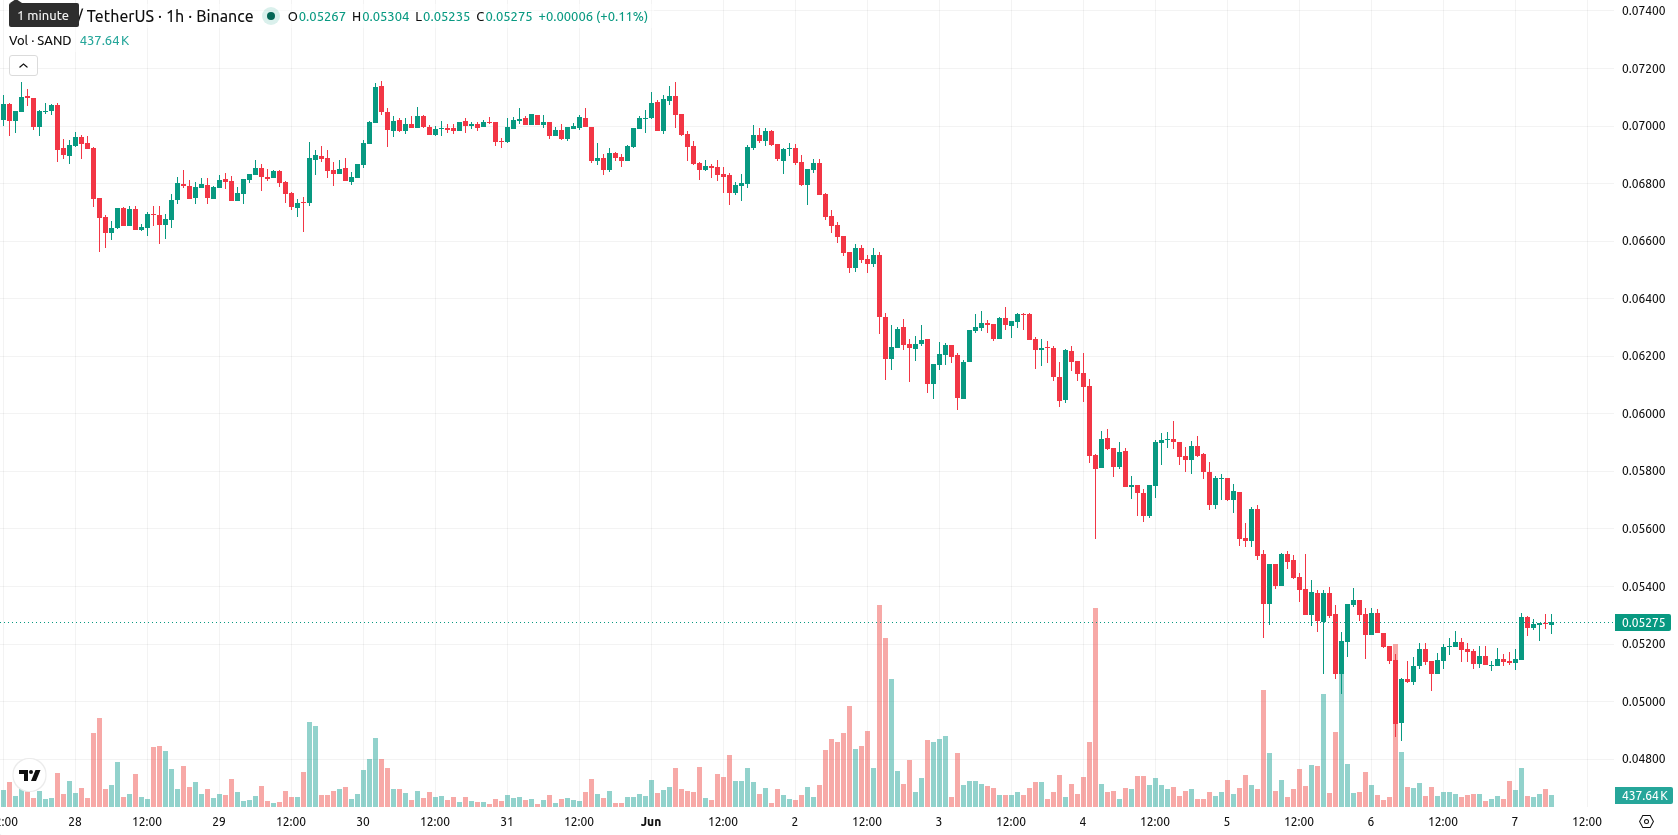
Sandbox (SAND) is trading at $0.0527, up 2.55% on the day and marking a session high. The asset remains positioned above its key moving averages, reflecting a constructive short-term setup.
Highlights
- SAND/USD shows bullish short- and medium-term momentum but remains pressured by a weak longer-term trend.
- Several oscillators are overbought while trend-following indicators remain mixed, suggesting risk of near-term reversal or consolidation.
- Price is expected to trade sideways within a $0.0476 to $0.0578 range, with downside risk slightly outweighing upside over the next few days.
Mixed momentum signals as price tests technical boundaries
On the hourly chart, SAND is trading above the MA-20 at $0.0518 and MA-50 at $0.0525, while on the daily timeframe, it remains below the MA-200 set at $0.0986. The Ichimoku Kijun level at $0.0508 provides immediate support. The RSI stands at 56.57, indicating a Buy signal, with Stoch RSI and CCI both in the overbought zone. The MACD remains Neutral, ADX signals Sell, BBP shows intraday buyer dominance, and the Awesome Oscillator aligns with the upward tone, but several momentum indicators display mixed signals, suggesting an emerging divergence.
Sideways bias prevails as upside faces resistance
Over the next 2–3 trading days, SAND is likely to consolidate within a typical volatility band between $0.0476 and $0.0578. Scenario analysis places the probability of an upward move at 48%, with a slightly higher chance of a downward move at 52%. The baseline expectation is for continued sideways movement; a bullish breakout above the resistance range could validate further buyer strength, while a sustained break of support may prompt a sharper decline.
Earlier, analysts noted that Sandbox (SAND) was under persistent bearish pressure with negative momentum dominating price action. The recent shift toward a short-term constructive setup, alongside emerging mixed signals, suggests traders should monitor for a decisive breakout from consolidation as momentum diverges and the next trend becomes clearer.


Latest Sandbox News


-
 Afghanistan
-
 Albania
-
 Algeria
-
 Angola
-
 Argentina
-
 Armenia
-
 Australia
-
 Austria
-
 Azerbaijan
-
 Bahamas
-
 Bahrain
-
 Bangladesh
-
 Belarus
-
 Belgium
-
 Bolivia
-
 Botswana
-
 Brazil
-
 Brunei
-
 Bulgaria
-
 Cambodia
-
 Cameroon
-
 Canada
-
 Chile
Chile
-
 China
China
-
 Colombia
-
 Congo
Congo
-
 Costa Rica
-
 Cote d'Ivoire
-
 Croatia
-
 Cuba
Cuba
-
 Cyprus
-
 Czechia
-
 DR Congo
-
 Denmark
-
 Dominican Republic
-
 Ecuador
-
 Egypt
Egypt
-
 El Salvador
-
 Estonia
-
 Eswatini
-
 Ethiopia
-
 Finland
-
 France
-
 Georgia
-
 Germany
-
 Ghana
Ghana
-
 Greece
-
 Haiti
Haiti
-
 Hong Kong
-
 Hungary
-
 India
India
-
 Indonesia
-
 Iran, Islamic republic
-
 Iraq
Iraq
-
 Ireland
-
 Israel
-
 Italy
Italy
-
 Jamaica
-
 Japan
Japan
-
 Jordan
-
 Kazakhstan
-
 Kenya
Kenya
-
 Korea
Korea
-
 Kuwait
-
 Kyrgyzstan
-
 Laos
Laos
-
 Latvia
-
 Lebanon
-
 Lesotho
-
 Libya
Libya
-
 Lithuania
-
 Luxembourg
-
 Madagascar
-
 Malaysia
-
 Malta
Malta
-
 Mauritius
-
 Mexico
-
 Moldova
-
 Mongolia
-
 Montenegro
-
 Morocco
-
 Mozambique
-
 Myanmar
-
 Namibia
-
 Nepal
Nepal
-
 Netherlands
-
 New Zealand
-
 Nigeria
-
 North Macedonia
-
 Norway
-
 Oman
Oman
-
 Pakistan
-
 Palestine
-
 Panama
-
 Papua New Guinea
-
 Paraguay
-
 Peru
Peru
-
 Philippines
-
 Poland
-
 Portugal
-
 Puerto Rico
-
 Qatar
Qatar
-
 Reunion
-
 Romania
-
 Rwanda
-
 Saudi Arabia
-
 Serbia
-
 Singapore
-
 Slovakia
-
 Slovenia
-
 Somalia
-
 South Africa
-
 Spain
Spain
-
 Sri Lanka
-
 Sweden
-
 Switzerland
-
 Syria
Syria
-
 Taiwan
-
 Tajikistan
-
 Tanzania
-
 Thailand
-
 Trinidad and Tobago
-
 Tunisia
-
 Turkey
-
 UAE
UAE
-
 Uganda
-
 Ukraine
-
 United Kingdom
-
United States
-
 Uruguay
-
 Uzbekistan
-
 Venezuela
-
 Vietnam
-
 Yemen
Yemen
-
 Zambia
-
 Zimbabwe
- Forex
- Crypto
