
-15.44% for Movement as oversold status limits additional selling

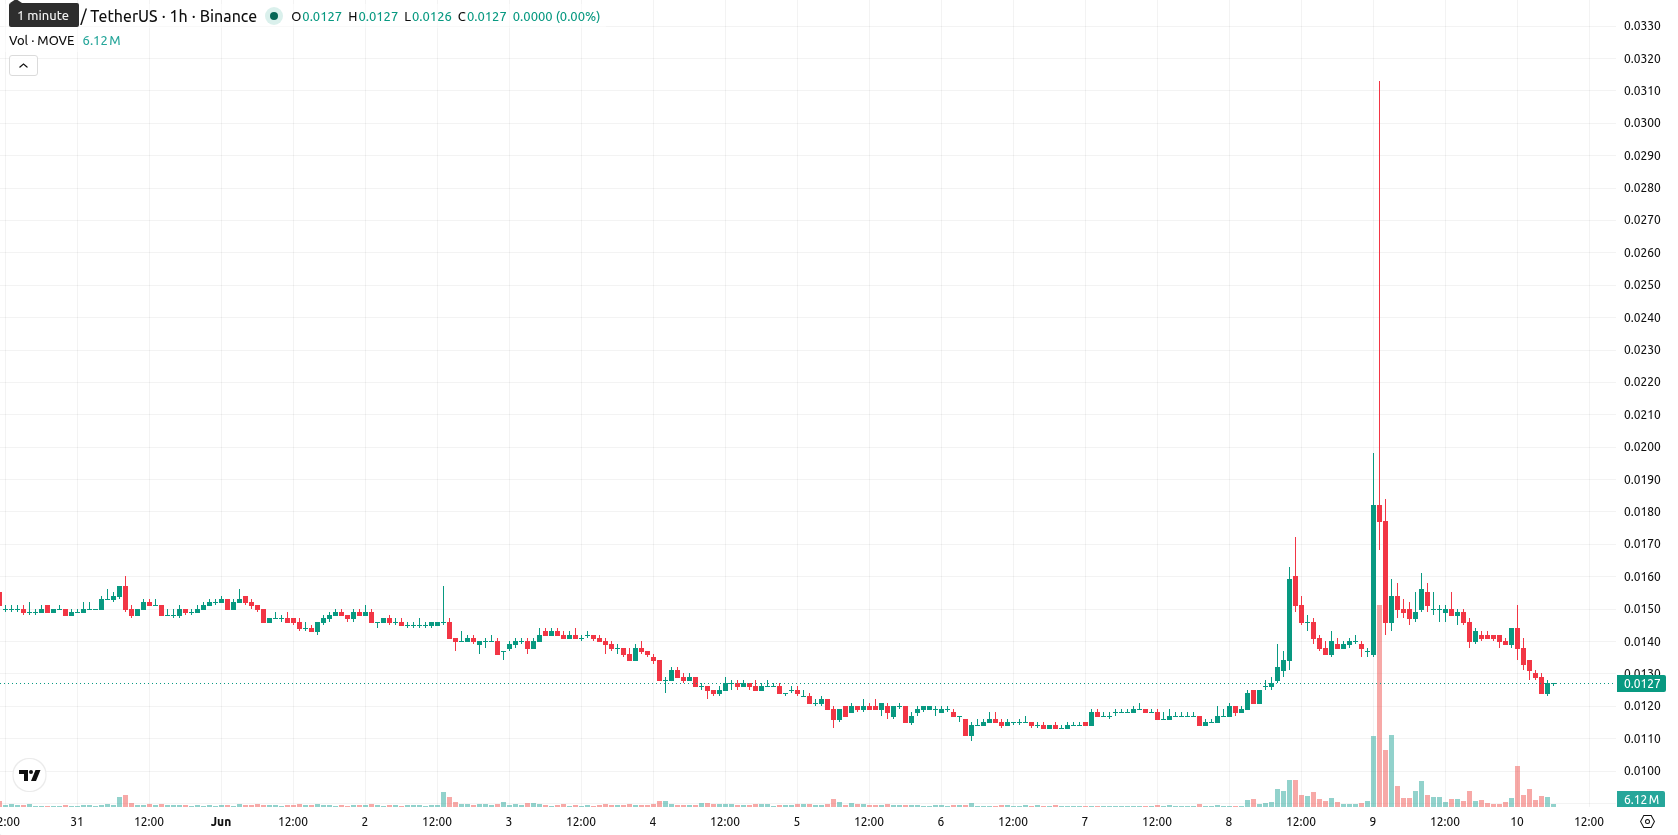
Movement (MOVE) is trading at $0.0126, marking a daily decline of 15.44%. The asset currently sits below its key moving averages, reflecting ongoing downward momentum.
Highlights
- MOVE/USD remains under sustained bearish pressure, trading well below key moving averages across all timeframes.
- Momentum indicators confirm dominance by sellers, with strong negative signals and persistent oversold conditions observed intraday.
- Price is forecast to fluctuate between $0.0101 and $0.0151 over the next few days, with a 75% probability of further downside.
Bearish confirmation as multiple indicators turn oversold
MOVE/USD is positioned below the MA-20 ($0.0140), MA-50 ($0.0142), and MA-200 ($0.0262) on the hourly chart. The Ichimoku Kijun at $0.0142 presents the closest resistance. Technical momentum is confirmed negative: MACD is in sell mode, ADX registers a strong trend, and RSI reads 35.74, denoting a weak setup. The CCI and Stoch RSI are both in oversold territory, while BBP also indicates seller dominance. The Awesome Oscillator aligns with this bearish confirmation, as price action remains near intraday lows accompanied by high volatility.
Downside risk elevated amid channel-bound volatility
In the coming 2–3 trading days, MOVE/USD is expected to fluctuate within the $0.0101 to $0.0151 band, reflecting typical volatility for current levels. The probability for an upward move is estimated at 25%, while a continued decline holds a 75% probability. Holding within this horizontal channel forms the baseline scenario. A bullish shift would require a break above $0.0142, while a move below $0.0101 signals further downside.
Earlier, analysts noted that Movement was experiencing mixed momentum signals, with upside potential limited by persistent indicator divergences and unresolved bearish pressure. The current deterioration in technicals and increased probability of further downside confirm the shift to a strongly bearish scenario, making a decisive break below recent lows the primary near-term risk.


-
 Afghanistan
-
 Albania
-
 Algeria
-
 Angola
-
 Argentina
-
 Armenia
-
 Australia
-
 Austria
-
 Azerbaijan
-
 Bahamas
-
 Bahrain
-
 Bangladesh
-
 Belarus
-
 Belgium
-
 Bolivia
-
 Botswana
-
 Brazil
-
 Brunei
-
 Bulgaria
-
 Cambodia
-
 Cameroon
-
 Canada
-
 Chile
Chile
-
 China
China
-
 Colombia
-
 Congo
Congo
-
 Costa Rica
-
 Cote d'Ivoire
-
 Croatia
-
 Cuba
Cuba
-
 Cyprus
-
 Czechia
-
 DR Congo
-
 Denmark
-
 Dominican Republic
-
 Ecuador
-
 Egypt
Egypt
-
 El Salvador
-
 Estonia
-
 Eswatini
-
 Ethiopia
-
 Finland
-
 France
-
 Georgia
-
 Germany
-
 Ghana
Ghana
-
 Greece
-
 Haiti
Haiti
-
 Hong Kong
-
 Hungary
-
 India
India
-
 Indonesia
-
 Iran, Islamic republic
-
 Iraq
Iraq
-
 Ireland
-
 Israel
-
 Italy
Italy
-
 Jamaica
-
 Japan
Japan
-
 Jordan
-
 Kazakhstan
-
 Kenya
Kenya
-
 Korea
Korea
-
 Kuwait
-
 Kyrgyzstan
-
 Laos
Laos
-
 Latvia
-
 Lebanon
-
 Lesotho
-
 Libya
Libya
-
 Lithuania
-
 Luxembourg
-
 Madagascar
-
 Malaysia
-
 Malta
Malta
-
 Mauritius
-
 Mexico
-
 Moldova
-
 Mongolia
-
 Montenegro
-
 Morocco
-
 Mozambique
-
 Myanmar
-
 Namibia
-
 Nepal
Nepal
-
 Netherlands
-
 New Zealand
-
 Nigeria
-
 North Macedonia
-
 Norway
-
 Oman
Oman
-
 Pakistan
-
 Palestine
-
 Panama
-
 Papua New Guinea
-
 Paraguay
-
 Peru
Peru
-
 Philippines
-
 Poland
-
 Portugal
-
 Puerto Rico
-
 Qatar
Qatar
-
 Reunion
-
 Romania
-
 Rwanda
-
 Saudi Arabia
-
 Serbia
-
 Singapore
-
 Slovakia
-
 Slovenia
-
 Somalia
-
 South Africa
-
 Spain
Spain
-
 Sri Lanka
-
 Sweden
-
 Switzerland
-
 Syria
Syria
-
 Taiwan
-
 Tajikistan
-
 Tanzania
-
 Thailand
-
 Trinidad and Tobago
-
 Tunisia
-
 Turkey
-
 UAE
UAE
-
 Uganda
-
 Ukraine
-
 United Kingdom
-
United States
-
 Uruguay
-
 Uzbekistan
-
 Venezuela
-
 Vietnam
-
 Yemen
Yemen
-
 Zambia
-
 Zimbabwe
- Forex
- Crypto
