
Optimism drops amid oversold conditions shown by RSI and Stochastic RSI: weekly analysis

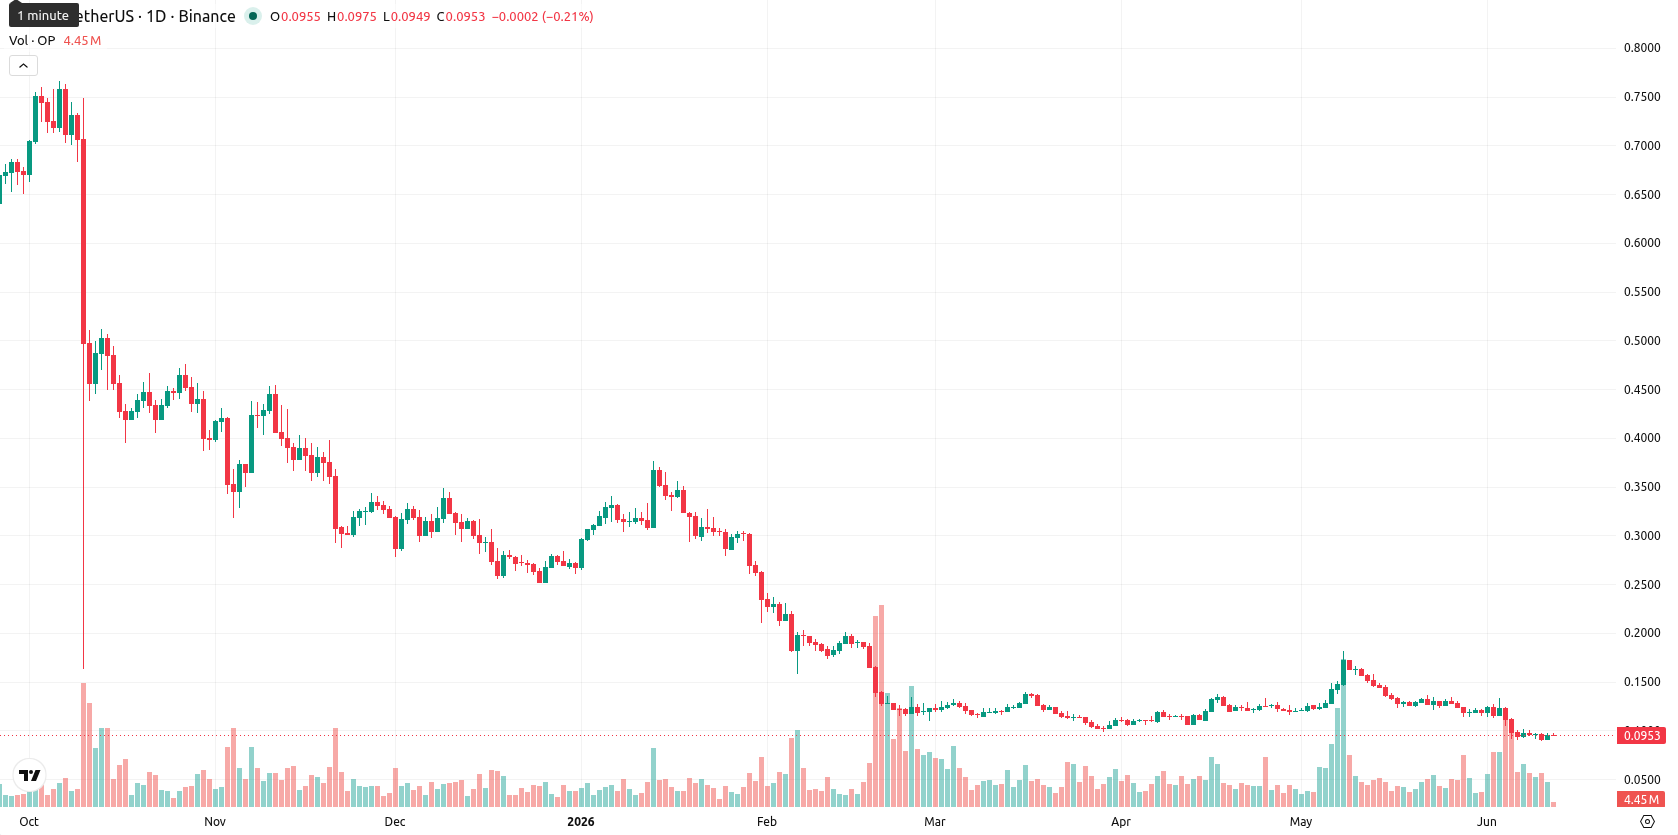
Optimism (OP) is trading at $0.0952, well below the weekly MA-20 at $0.1313 and MA-50 at $0.3670, which highlights persistent selling pressure from both medium- and longer-term trends. Over the past week, OP fell by $0.0077 (7.58%), moving within the middle of its weekly range and remaining firmly under its key moving averages.
Highlights
- OP remains under heavy selling pressure, consistently trading below key moving averages across medium- and long-term trends.
- Momentum indicators show a strong bearish trend with persistent negative signals, despite OP's price entering oversold territory.
- OP is expected to consolidate between $0.0860 and $0.1045 over the next week, with further downside risk if support fails.
Bearish momentum prevails as technical signals reinforce downside risk
On the weekly chart, OP continues to trade below both its MA-20 and MA-50, with the Ichimoku Kijun indicating dynamic resistance well above the current price. MACD and ADX on the weekly timeframe confirm a dominant bearish trend, while RSI, Stochastic RSI, and CCI all show oversold or near-oversold conditions, implying the potential for limited technical rebound. Bull/Bear Power remains in favor of sellers, although the price volatility stands at 13.98%, suggesting that any recovery is likely to be restrained by prevailing negative momentum.
Consolidation expected as bearish bias limits upside breakout chance
Over the next 7 days, the baseline scenario is for OP to consolidate between $0.0860 and $0.1045, consistent with its recent volatility and ongoing bearish momentum on the weekly timeframe. There is a low probability (below 20%) for a decisive upward move, with no weekly indicators currently signaling a reversal. Should OP unexpectedly break above $0.1045, it could trigger a short-term recovery toward the MA-20. Conversely, a drop below $0.0860 would expose OP to further downside and increase the likelihood of a retest of recent lows.
Earlier, analysts noted a shift toward short-term bullish momentum for Optimism, with technical signals pointing to the potential for further upside. However, the sustained weakness now apparent in both the weekly trend and broader momentum underscores the importance of monitoring the $0.0860 support level, as a break below it could accelerate downside risk in the near term.


Latest Optimism News


-
 Afghanistan
-
 Albania
-
 Algeria
-
 Angola
-
 Argentina
-
 Armenia
-
 Australia
-
 Austria
-
 Azerbaijan
-
 Bahamas
-
 Bahrain
-
 Bangladesh
-
 Belarus
-
 Belgium
-
 Bolivia
-
 Botswana
-
 Brazil
-
 Brunei
-
 Bulgaria
-
 Cambodia
-
 Cameroon
-
 Canada
-
 Chile
Chile
-
 China
China
-
 Colombia
-
 Congo
Congo
-
 Costa Rica
-
 Cote d'Ivoire
-
 Croatia
-
 Cuba
Cuba
-
 Cyprus
-
 Czechia
-
 DR Congo
-
 Denmark
-
 Dominican Republic
-
 Ecuador
-
 Egypt
Egypt
-
 El Salvador
-
 Estonia
-
 Eswatini
-
 Ethiopia
-
 Finland
-
 France
-
 Georgia
-
 Germany
-
 Ghana
Ghana
-
 Greece
-
 Haiti
Haiti
-
 Hong Kong
-
 Hungary
-
 India
India
-
 Indonesia
-
 Iran, Islamic republic
-
 Iraq
Iraq
-
 Ireland
-
 Israel
-
 Italy
Italy
-
 Jamaica
-
 Japan
Japan
-
 Jordan
-
 Kazakhstan
-
 Kenya
Kenya
-
 Korea
Korea
-
 Kuwait
-
 Kyrgyzstan
-
 Laos
Laos
-
 Latvia
-
 Lebanon
-
 Lesotho
-
 Libya
Libya
-
 Lithuania
-
 Luxembourg
-
 Madagascar
-
 Malaysia
-
 Malta
Malta
-
 Mauritius
-
 Mexico
-
 Moldova
-
 Mongolia
-
 Montenegro
-
 Morocco
-
 Mozambique
-
 Myanmar
-
 Namibia
-
 Nepal
Nepal
-
 Netherlands
-
 New Zealand
-
 Nigeria
-
 North Macedonia
-
 Norway
-
 Oman
Oman
-
 Pakistan
-
 Palestine
-
 Panama
-
 Papua New Guinea
-
 Paraguay
-
 Peru
Peru
-
 Philippines
-
 Poland
-
 Portugal
-
 Puerto Rico
-
 Qatar
Qatar
-
 Reunion
-
 Romania
-
 Rwanda
-
 Saudi Arabia
-
 Serbia
-
 Singapore
-
 Slovakia
-
 Slovenia
-
 Somalia
-
 South Africa
-
 Spain
Spain
-
 Sri Lanka
-
 Sweden
-
 Switzerland
-
 Syria
Syria
-
 Taiwan
-
 Tajikistan
-
 Tanzania
-
 Thailand
-
 Trinidad and Tobago
-
 Tunisia
-
 Turkey
-
 UAE
UAE
-
 Uganda
-
 Ukraine
-
 United Kingdom
-
United States
-
 Uruguay
-
 Uzbekistan
-
 Venezuela
-
 Vietnam
-
 Yemen
Yemen
-
 Zambia
-
 Zimbabwe
- Forex
- Crypto
