
GRT maintains narrow range as strong resistance at MA-20 caps price action: weekly review

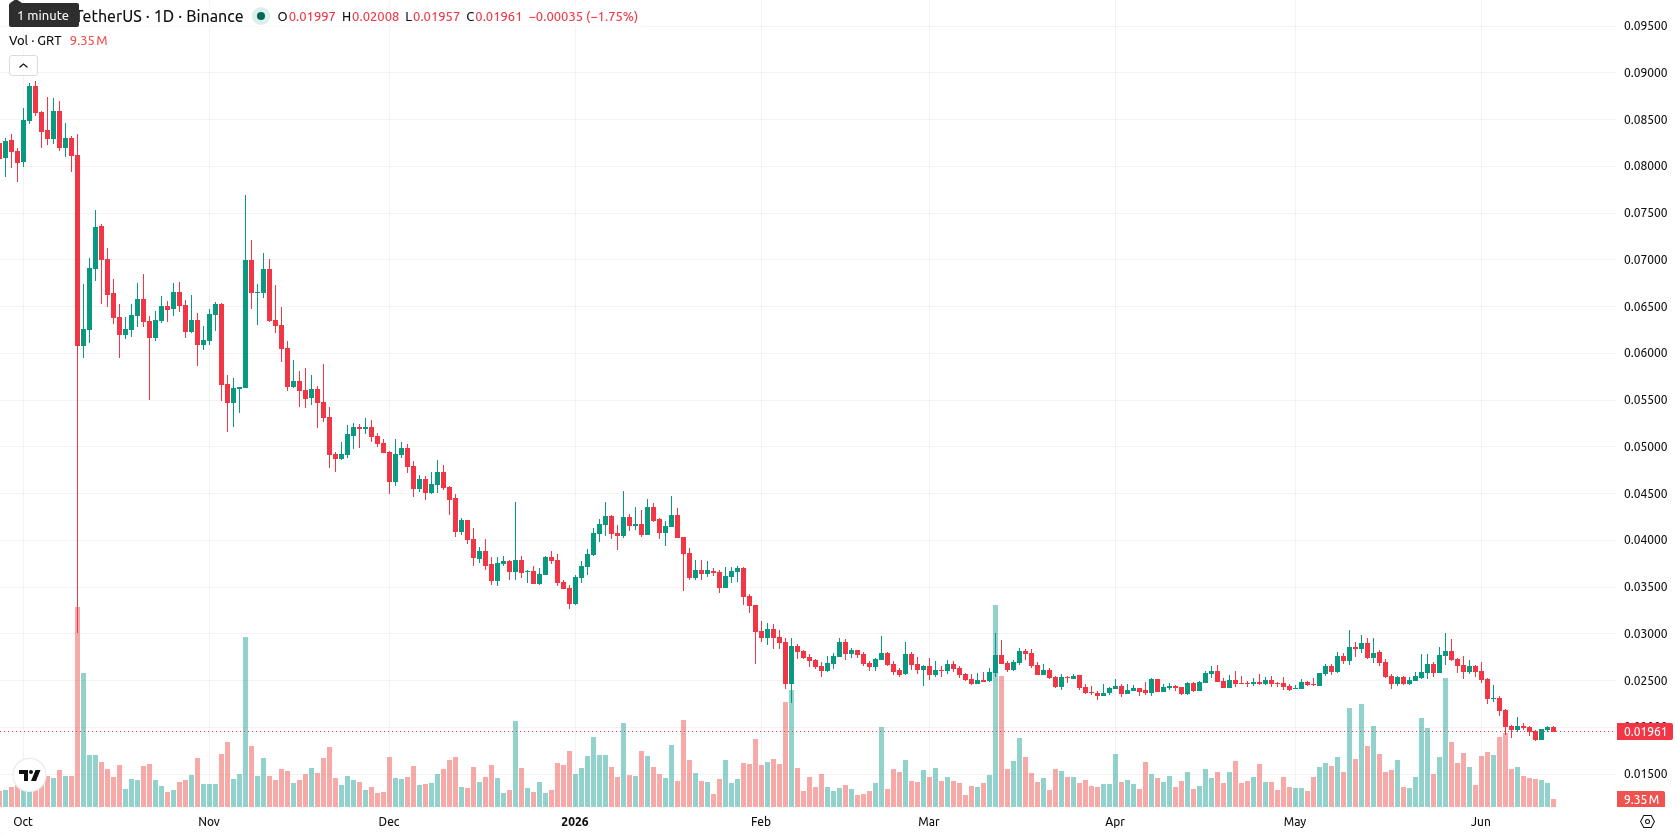
The Graph (GRT) is currently trading at $0.019596, showing almost no change over the past week with a marginal gain of $0.0000 (0.05%). The asset remains well below its weekly MA-20 ($0.02515200), MA-50 ($0.05252940), and MA-200 ($0.12772435), highlighting sustained pressure from medium- and long-term bearish trends.
Highlights
- GRT trades well below major moving averages, signaling sustained medium- and long-term bearish momentum.
- Technical indicators show strong selling pressure, with negative momentum, oversold conditions, and no signs of reversal.
- Price is expected to consolidate between $0.01700 and $0.02230 over the next week, with a higher probability of downside.
Firm weekly bearish momentum as oversold signals persist
On the weekly chart, GRT continues to face pronounced negative momentum. The MACD signals a strong sell while the ADX points to persistent bearish strength. Both the RSI and CCI indicate oversold conditions, and Bull/Bear Power remains negative, underlining that sellers are in firm control. Stochastic RSI is neutral, reflecting seller exhaustion but lacking support for a reversal. Weekly volatility registers at 13.93%, with the price consolidating in the middle of its recent range after tests of both range boundaries.
Limited upside next week as bearish signals reduce recovery odds
Looking ahead over the next 7 days, GRT is expected to trade between $0.01700 and $0.02230 in line with current volatility and trend direction. The baseline scenario points to stabilization within this corridor, as the lack of buy signals across four key indicators diminishes the probability of a meaningful upward move (less than 20%). A sustained break above $0.02230 could prompt a bullish scenario, though technicals show weak support for this outcome. A move below the $0.01700 support would likely trigger further downside, consistent with prevailing bearish momentum.
Earlier, analysts noted that The Graph displayed a cautiously bullish outlook, buoyed by short-term momentum but tempered by mixed signals and potential volatility. The current bearish momentum and lack of buying signals now suggest traders should closely monitor the $0.01700 support level, as a break below it could accelerate further downside in the coming week.


-
 Afghanistan
-
 Albania
-
 Algeria
-
 Angola
-
 Argentina
-
 Armenia
-
 Australia
-
 Austria
-
 Azerbaijan
-
 Bahamas
-
 Bahrain
-
 Bangladesh
-
 Belarus
-
 Belgium
-
 Bolivia
-
 Botswana
-
 Brazil
-
 Brunei
-
 Bulgaria
-
 Cambodia
-
 Cameroon
-
 Canada
-
 Chile
Chile
-
 China
China
-
 Colombia
-
 Congo
Congo
-
 Costa Rica
-
 Cote d'Ivoire
-
 Croatia
-
 Cuba
Cuba
-
 Cyprus
-
 Czechia
-
 DR Congo
-
 Denmark
-
 Dominican Republic
-
 Ecuador
-
 Egypt
Egypt
-
 El Salvador
-
 Estonia
-
 Eswatini
-
 Ethiopia
-
 Finland
-
 France
-
 Georgia
-
 Germany
-
 Ghana
Ghana
-
 Greece
-
 Haiti
Haiti
-
 Hong Kong
-
 Hungary
-
 India
India
-
 Indonesia
-
 Iran, Islamic republic
-
 Iraq
Iraq
-
 Ireland
-
 Israel
-
 Italy
Italy
-
 Jamaica
-
 Japan
Japan
-
 Jordan
-
 Kazakhstan
-
 Kenya
Kenya
-
 Korea
Korea
-
 Kuwait
-
 Kyrgyzstan
-
 Laos
Laos
-
 Latvia
-
 Lebanon
-
 Lesotho
-
 Libya
Libya
-
 Lithuania
-
 Luxembourg
-
 Madagascar
-
 Malaysia
-
 Malta
Malta
-
 Mauritius
-
 Mexico
-
 Moldova
-
 Mongolia
-
 Montenegro
-
 Morocco
-
 Mozambique
-
 Myanmar
-
 Namibia
-
 Nepal
Nepal
-
 Netherlands
-
 New Zealand
-
 Nigeria
-
 North Macedonia
-
 Norway
-
 Oman
Oman
-
 Pakistan
-
 Palestine
-
 Panama
-
 Papua New Guinea
-
 Paraguay
-
 Peru
Peru
-
 Philippines
-
 Poland
-
 Portugal
-
 Puerto Rico
-
 Qatar
Qatar
-
 Reunion
-
 Romania
-
 Rwanda
-
 Saudi Arabia
-
 Serbia
-
 Singapore
-
 Slovakia
-
 Slovenia
-
 Somalia
-
 South Africa
-
 Spain
Spain
-
 Sri Lanka
-
 Sweden
-
 Switzerland
-
 Syria
Syria
-
 Taiwan
-
 Tajikistan
-
 Tanzania
-
 Thailand
-
 Trinidad and Tobago
-
 Tunisia
-
 Turkey
-
 UAE
UAE
-
 Uganda
-
 Ukraine
-
 United Kingdom
-
United States
-
 Uruguay
-
 Uzbekistan
-
 Venezuela
-
 Vietnam
-
 Yemen
Yemen
-
 Zambia
-
 Zimbabwe
- Forex
- Crypto
