
Curve sinks as short-term downtrend continues below long-term average

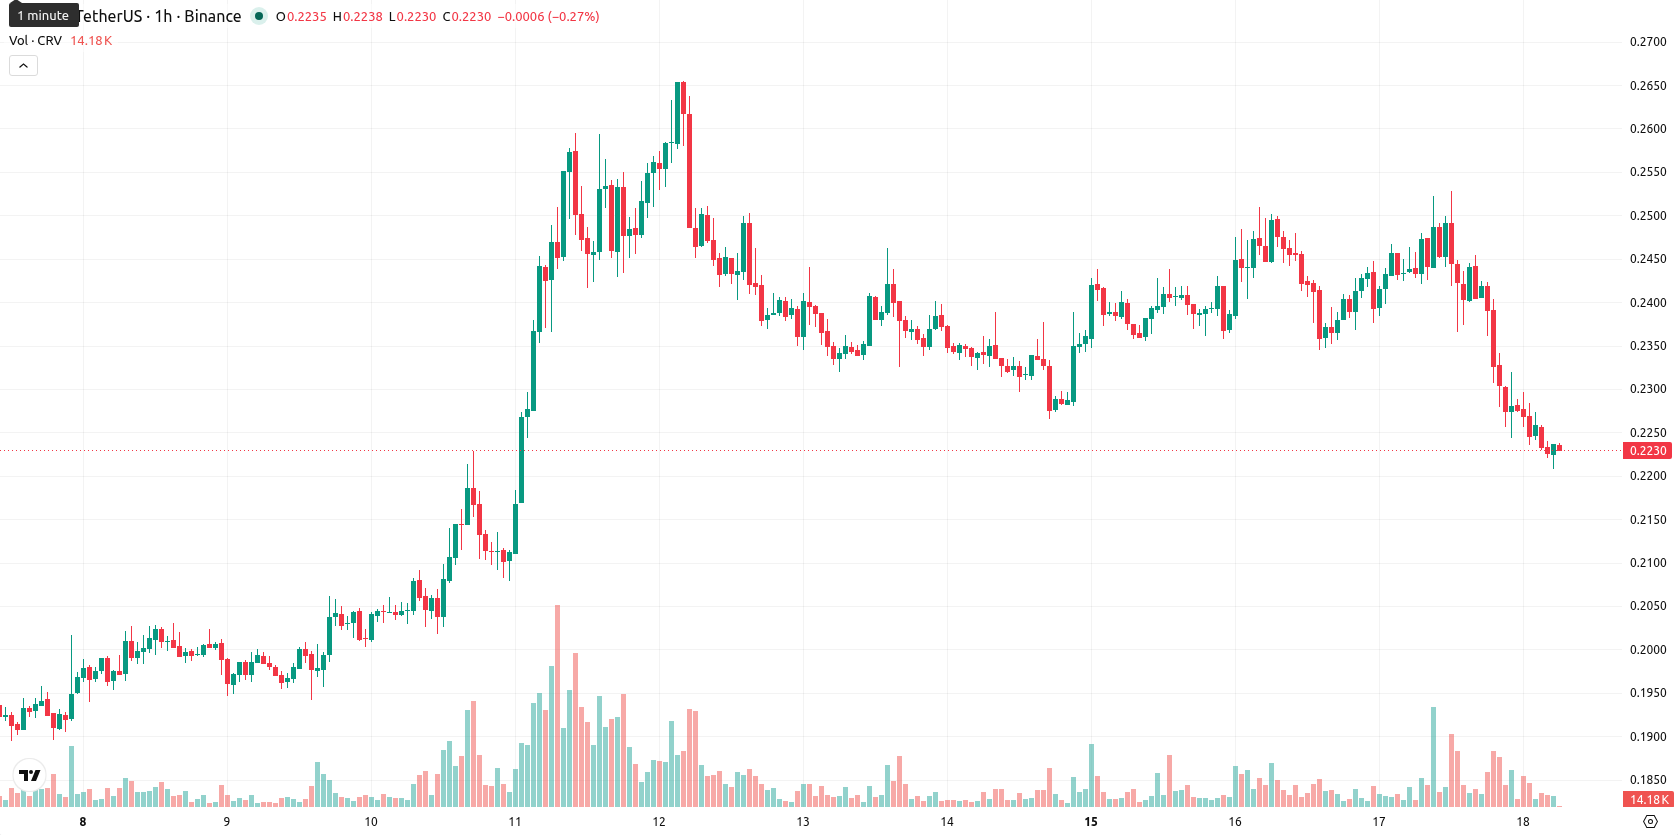
Curve (CRV) is trading at $0.2238, marking a decline of 8.24% on the day. The asset currently sits below its key moving averages, reflecting notable short-term and longer-term weakness.
Highlights
- CRV/USD remains firmly below key moving averages, indicating sustained bearish momentum across all timeframes.
- Momentum and trend indicators signal strong sell pressure, with oversold readings and no counter-trend signals present.
- Price is expected to trade between $0.2146 and $0.2451 over the next 2–3 days, with downside breakout risk elevated.
Bear dominance reinforced as multiple indicators hit oversold territory
CRV/USD is trading below the MA-20 ($0.2340) and MA-50 ($0.2394) on the hourly chart. The daily chart shows continued weakness, with price also well below the MA-200 ($0.2813), while the Ichimoku Kijun at $0.2368 now acts as immediate overhead resistance. Momentum indicators reflect deep bearishness: MACD and ADX maintain a strong sell bias, and RSI, Stoch RSI, and CCI all register oversold conditions. Bear dominance is reinforced by a negative BBP reading and confirmed by the Awesome Oscillator, with no conflicting signals present.
Downside risk prevails as support break threatens rebound
Over the next 2–3 trading days, CRV/USD is expected to move within the $0.2146–$0.2451 band, reflecting typical volatility around current levels. The probability of an upward move is assessed as very low, with risk tilted toward additional downside if support fails. A baseline scenario calls for continued sideways price action in this range, though a breakout above $0.2368 could provide room for a rebound toward the upper end. If support at $0.2146 gives way, further declines remain a clear risk.
Earlier, analysts noted that Curve (CRV) was exhibiting persistent bearish momentum with sideways price action expected to dominate. The current breakdown below all key moving averages and the reinforcement of downside risk by multiple technical indicators strengthen the case for closely monitoring support at $0.2146, as a breach here could accelerate further declines.


-
 Afghanistan
-
 Albania
-
 Algeria
-
 Angola
-
 Argentina
-
 Armenia
-
 Australia
-
 Austria
-
 Azerbaijan
-
 Bahamas
-
 Bahrain
-
 Bangladesh
-
 Belarus
-
 Belgium
-
 Bolivia
-
 Botswana
-
 Brazil
-
 Brunei
-
 Bulgaria
-
 Cambodia
-
 Cameroon
-
 Canada
-
 Chile
Chile
-
 China
China
-
 Colombia
-
 Congo
Congo
-
 Costa Rica
-
 Cote d'Ivoire
-
 Croatia
-
 Cuba
Cuba
-
 Cyprus
-
 Czechia
-
 DR Congo
-
 Denmark
-
 Dominican Republic
-
 Ecuador
-
 Egypt
Egypt
-
 El Salvador
-
 Estonia
-
 Eswatini
-
 Ethiopia
-
 Finland
-
 France
-
 Georgia
-
 Germany
-
 Ghana
Ghana
-
 Greece
-
 Haiti
Haiti
-
 Hong Kong
-
 Hungary
-
 India
India
-
 Indonesia
-
 Iran, Islamic republic
-
 Iraq
Iraq
-
 Ireland
-
 Israel
-
 Italy
Italy
-
 Jamaica
-
 Japan
Japan
-
 Jordan
-
 Kazakhstan
-
 Kenya
Kenya
-
 Korea
Korea
-
 Kuwait
-
 Kyrgyzstan
-
 Laos
Laos
-
 Latvia
-
 Lebanon
-
 Lesotho
-
 Libya
Libya
-
 Lithuania
-
 Luxembourg
-
 Madagascar
-
 Malaysia
-
 Malta
Malta
-
 Mauritius
-
 Mexico
-
 Moldova
-
 Mongolia
-
 Montenegro
-
 Morocco
-
 Mozambique
-
 Myanmar
-
 Namibia
-
 Nepal
Nepal
-
 Netherlands
-
 New Zealand
-
 Nigeria
-
 North Macedonia
-
 Norway
-
 Oman
Oman
-
 Pakistan
-
 Palestine
-
 Panama
-
 Papua New Guinea
-
 Paraguay
-
 Peru
Peru
-
 Philippines
-
 Poland
-
 Portugal
-
 Puerto Rico
-
 Qatar
Qatar
-
 Reunion
-
 Romania
-
 Rwanda
-
 Saudi Arabia
-
 Serbia
-
 Singapore
-
 Slovakia
-
 Slovenia
-
 Somalia
-
 South Africa
-
 Spain
Spain
-
 Sri Lanka
-
 Sweden
-
 Switzerland
-
 Syria
Syria
-
 Taiwan
-
 Tajikistan
-
 Tanzania
-
 Thailand
-
 Trinidad and Tobago
-
 Tunisia
-
 Turkey
-
 UAE
UAE
-
 Uganda
-
 Ukraine
-
 United Kingdom
-
United States
-
 Uruguay
-
 Uzbekistan
-
 Venezuela
-
 Vietnam
-
 Yemen
Yemen
-
 Zambia
-
 Zimbabwe
- Forex
- Crypto
