
LTC bounces within recent range as all major moving averages point lower: weekly forecast

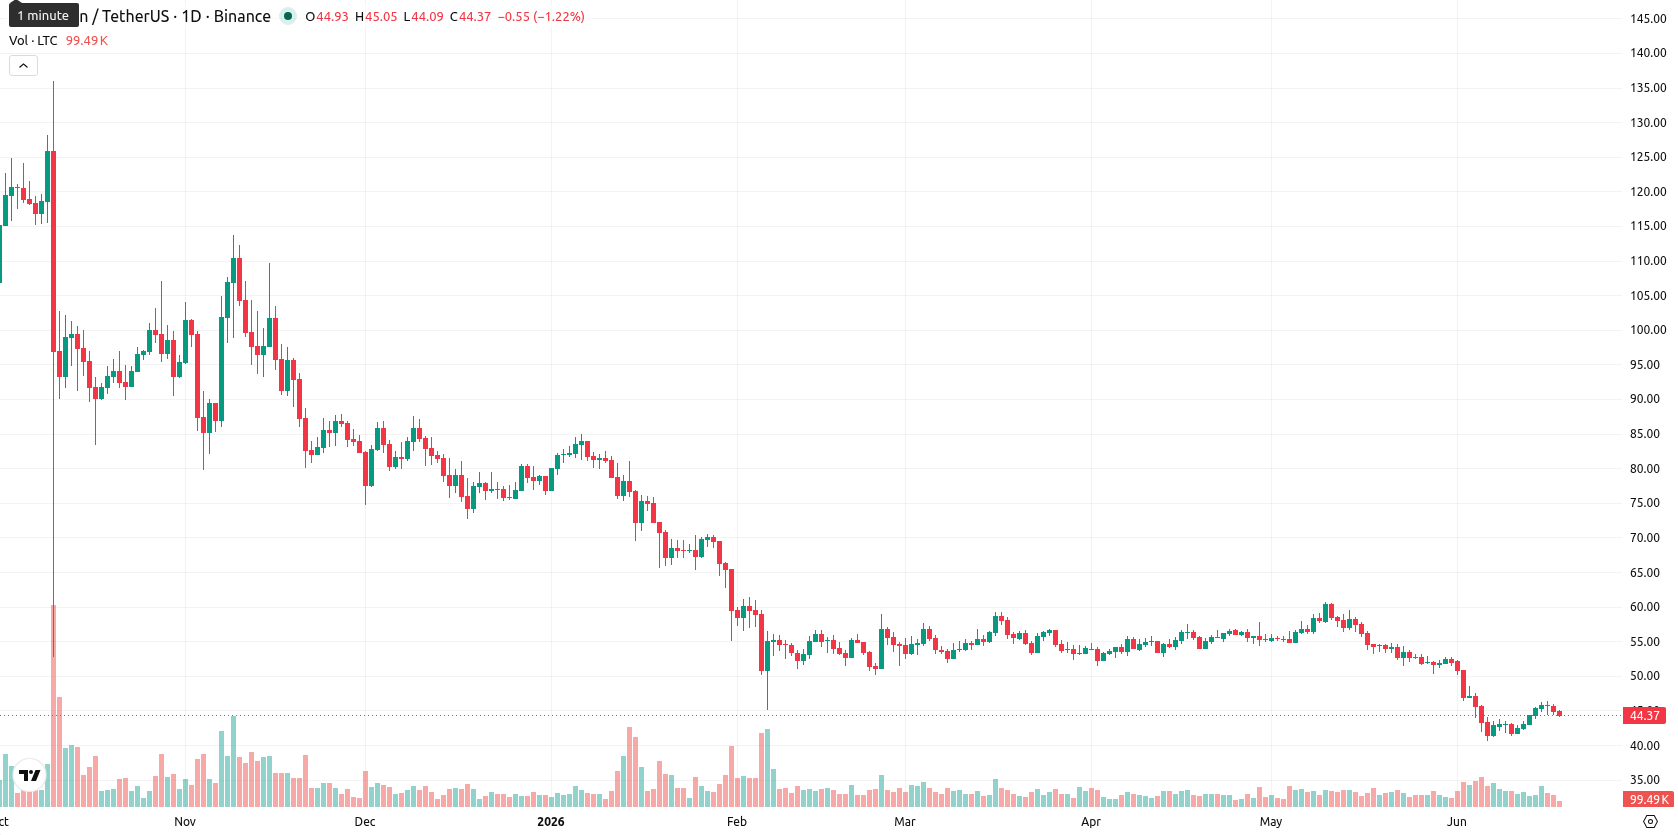
Litecoin (LTC) has risen $1.83 (4.30%) over the past week, currently trading in the middle of its weekly range, with volatility at 9.88%. The asset remains well below its weekly MA-20 ($52.91), MA-50 ($79.49), and MA-200 ($80.60), indicating continued bearish pressure with no support from medium- or long-term moving averages.
Highlights
- Litecoin remains entrenched in a bearish medium- to long-term trend, trading below key moving averages and showing continued downward pressure.
- Momentum and trend indicators confirm persistent selling, with oversold signals yet no technical evidence of a near-term rebound.
- Expected trading range for the upcoming week is $40.00 to $48.50, with a low probability of breaking above resistance and likely consolidation or further downside.
Muted ETF inflows as institutional debut meets subdued adoption
The launch of the first US spot Litecoin ETF, Canary Capital's LTCC, on Nasdaq marked a milestone for regulated institutional access, following the SEC and CFTC's classification of Litecoin as a commodity. Despite this development, net inflows into the ETF have been modest, with assets under management reported between $5.4 million and $9.3 million after eight months of trading. No major protocol upgrades or new enterprise partnerships have been announced, and the network continues to promote itself as digital silver amid reduced traction.
Sustained bearish momentum as all indicators confirm downside this week
On the weekly chart, Litecoin trades well beneath all major moving averages (MA-20 at $52.91, MA-50 at $79.49, MA-200 at $80.60), highlighting persistent downside risk and confirming a sustained bearish trend. Momentum indicators are negative: the MACD signals strong selling, ADX shows a dominant downtrend, and all key oscillators (RSI, Stochastic RSI, CCI) are in oversold territory. Bear Power remains deeply negative, supporting the case for continued seller control, while the Ichimoku Kijun offers no nearby support due to a wide gap above spot prices.
Range-bound outlook as oversold signals persist into next week
Over the next 7 days, Litecoin is expected to trade within a $40.00 to $48.50 range, reflecting consolidation after recent declines. The weekly setup favors sideways movement as all four primary momentum indicators remain bearish and none confirm a reversal, leaving the probability of sustained upside below 20%. If Litecoin breaks above $48.50 with volume, a relief rally may occur, but renewed selling could revisit the $40.00 level or lower. The baseline scenario remains range-bound trading driven by oversold weekly momentum amid a lack of bullish signals.
Earlier, analysts noted that Hims & Hers Health was experiencing heightened bullish momentum accompanied by the risk of volatility at key technical levels. In contrast, Litecoin now faces persistent downside pressure with all momentum indicators signaling continued bearish control, making the $48.50 resistance a critical level to watch for any potential shift in sentiment over the coming week.


Latest Litecoin News


-
 Afghanistan
-
 Albania
-
 Algeria
-
 Angola
-
 Argentina
-
 Armenia
-
 Australia
-
 Austria
-
 Azerbaijan
-
 Bahamas
-
 Bahrain
-
 Bangladesh
-
 Belarus
-
 Belgium
-
 Bolivia
-
 Botswana
-
 Brazil
-
 Brunei
-
 Bulgaria
-
 Cambodia
-
 Cameroon
-
 Canada
-
 Chile
Chile
-
 China
China
-
 Colombia
-
 Congo
Congo
-
 Costa Rica
-
 Cote d'Ivoire
-
 Croatia
-
 Cuba
Cuba
-
 Cyprus
-
 Czechia
-
 DR Congo
-
 Denmark
-
 Dominican Republic
-
 Ecuador
-
 Egypt
Egypt
-
 El Salvador
-
 Estonia
-
 Eswatini
-
 Ethiopia
-
 Finland
-
 France
-
 Georgia
-
 Germany
-
 Ghana
Ghana
-
 Greece
-
 Haiti
Haiti
-
 Hong Kong
-
 Hungary
-
 India
India
-
 Indonesia
-
 Iran, Islamic republic
-
 Iraq
Iraq
-
 Ireland
-
 Israel
-
 Italy
Italy
-
 Jamaica
-
 Japan
Japan
-
 Jordan
-
 Kazakhstan
-
 Kenya
Kenya
-
 Korea
Korea
-
 Kuwait
-
 Kyrgyzstan
-
 Laos
Laos
-
 Latvia
-
 Lebanon
-
 Lesotho
-
 Libya
Libya
-
 Lithuania
-
 Luxembourg
-
 Madagascar
-
 Malaysia
-
 Malta
Malta
-
 Mauritius
-
 Mexico
-
 Moldova
-
 Mongolia
-
 Montenegro
-
 Morocco
-
 Mozambique
-
 Myanmar
-
 Namibia
-
 Nepal
Nepal
-
 Netherlands
-
 New Zealand
-
 Nigeria
-
 North Macedonia
-
 Norway
-
 Oman
Oman
-
 Pakistan
-
 Palestine
-
 Panama
-
 Papua New Guinea
-
 Paraguay
-
 Peru
Peru
-
 Philippines
-
 Poland
-
 Portugal
-
 Puerto Rico
-
 Qatar
Qatar
-
 Reunion
-
 Romania
-
 Rwanda
-
 Saudi Arabia
-
 Serbia
-
 Singapore
-
 Slovakia
-
 Slovenia
-
 Somalia
-
 South Africa
-
 Spain
Spain
-
 Sri Lanka
-
 Sweden
-
 Switzerland
-
 Syria
Syria
-
 Taiwan
-
 Tajikistan
-
 Tanzania
-
 Thailand
-
 Trinidad and Tobago
-
 Tunisia
-
 Turkey
-
 UAE
UAE
-
 Uganda
-
 Ukraine
-
 United Kingdom
-
United States
-
 Uruguay
-
 Uzbekistan
-
 Venezuela
-
 Vietnam
-
 Yemen
Yemen
-
 Zambia
-
 Zimbabwe
- Forex
- Crypto
