
Sellers dominating short-term momentum sends Polkadot below $1

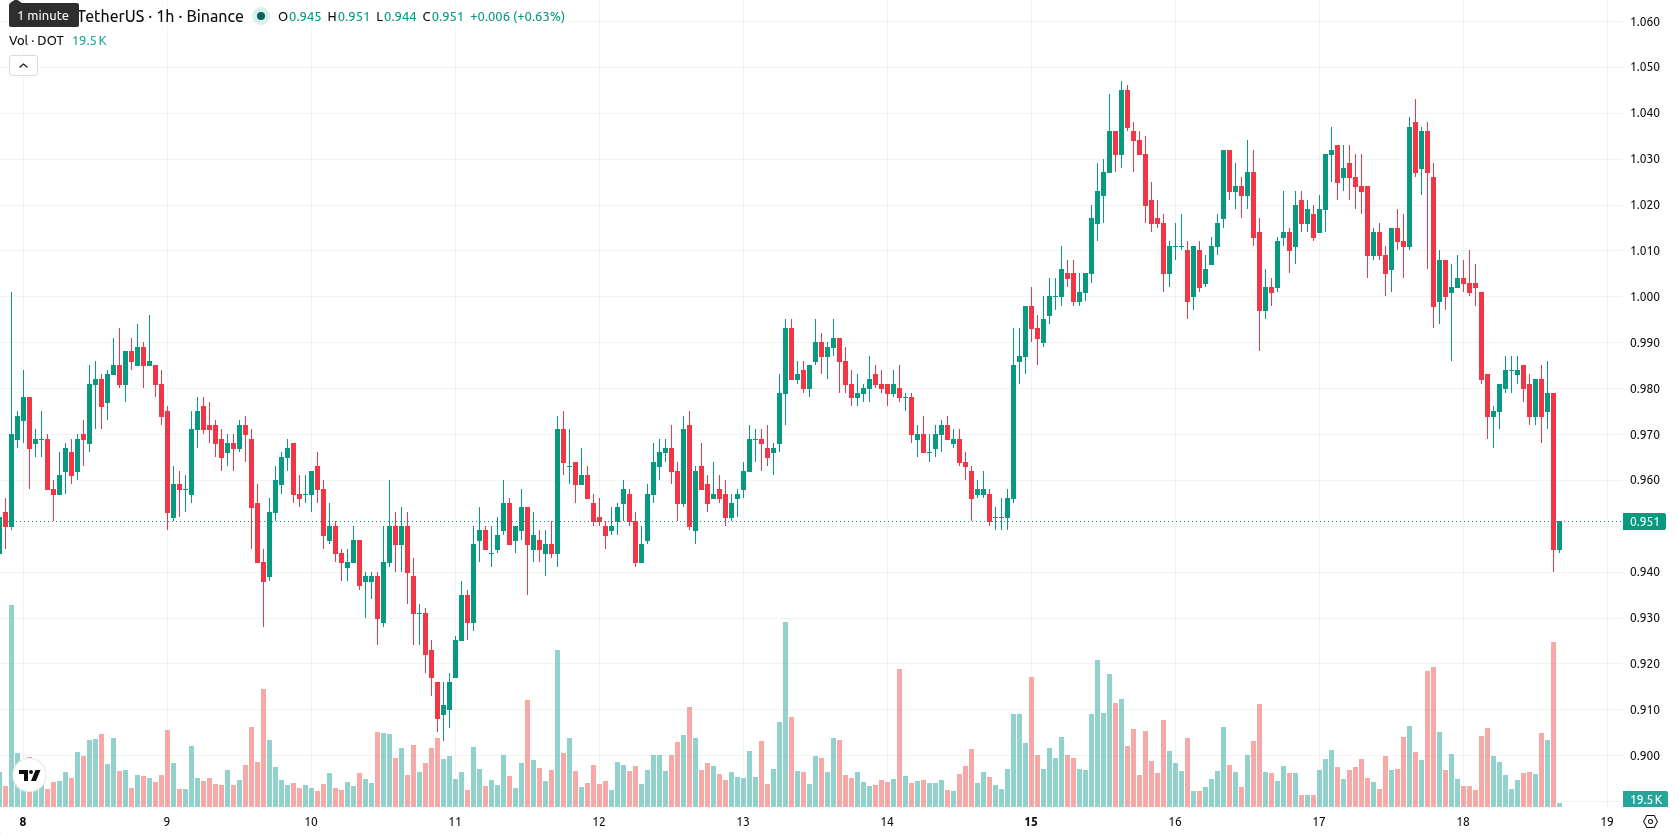
Polkadot (DOT) is trading at $0.945 after falling 8.78% for the day, with the price sitting below its key moving averages.
Highlights
- DOT/USD remains under persistent selling pressure, trading below key moving averages on all observed timeframes.
- Momentum indicators broadly signal bearish control intraday, despite occasional pockets of buyer activity and some oscillator divergence.
- The expected price range for the next 2–3 sessions is $0.921–$0.999, with a 64% probability of further declines.
Bearish momentum persists as support levels remain under threat
On the hourly chart, DOT is trading below the MA-20 ($0.988), MA-50 ($1.006), and the long-term MA-200 ($1.517). The nearest resistance is defined by the Ichimoku Kijun level at $1.005. Momentum remains negative as the MACD and ADX suggest continued downside risk, while the RSI stands at 39.733 and CCI confirms a sell bias. Stoch RSI and BBP indicate some sporadic buyer activity, but the dominant signals remain bearish. The Awesome Oscillator is neutral, and the presence of a minor gap and intraday volatility highlight prevailing uncertainty.
Downside risk dominates as volatility narrows trading range
Over the next 2–3 trading days, DOT is projected to trade within the $0.921 to $0.999 band, consistent with its current volatility. The baseline scenario favors further consolidation within this range, with a 64% probability of additional downside and a 36% chance of a bullish reversal. A close above immediate resistance could trigger short covering, while a drop below support may accelerate the prevailing downtrend.
Previously, analysts noted that Polkadot remained locked in a bearish outlook, with technical indicators pointing toward persistent downside risks. The latest intraday developments reinforce this narrative, and traders should monitor for a decisive move below current support, which could signal increased momentum toward further declines.


-
 Afghanistan
-
 Albania
-
 Algeria
-
 Angola
-
 Argentina
-
 Armenia
-
 Australia
-
 Austria
-
 Azerbaijan
-
 Bahamas
-
 Bahrain
-
 Bangladesh
-
 Belarus
-
 Belgium
-
 Bolivia
-
 Botswana
-
 Brazil
-
 Brunei
-
 Bulgaria
-
 Cambodia
-
 Cameroon
-
 Canada
-
 Chile
Chile
-
 China
China
-
 Colombia
-
 Congo
Congo
-
 Costa Rica
-
 Cote d'Ivoire
-
 Croatia
-
 Cuba
Cuba
-
 Cyprus
-
 Czechia
-
 DR Congo
-
 Denmark
-
 Dominican Republic
-
 Ecuador
-
 Egypt
Egypt
-
 El Salvador
-
 Estonia
-
 Eswatini
-
 Ethiopia
-
 Finland
-
 France
-
 Georgia
-
 Germany
-
 Ghana
Ghana
-
 Greece
-
 Haiti
Haiti
-
 Hong Kong
-
 Hungary
-
 India
India
-
 Indonesia
-
 Iran, Islamic republic
-
 Iraq
Iraq
-
 Ireland
-
 Israel
-
 Italy
Italy
-
 Jamaica
-
 Japan
Japan
-
 Jordan
-
 Kazakhstan
-
 Kenya
Kenya
-
 Korea
Korea
-
 Kuwait
-
 Kyrgyzstan
-
 Laos
Laos
-
 Latvia
-
 Lebanon
-
 Lesotho
-
 Libya
Libya
-
 Lithuania
-
 Luxembourg
-
 Madagascar
-
 Malaysia
-
 Malta
Malta
-
 Mauritius
-
 Mexico
-
 Moldova
-
 Mongolia
-
 Montenegro
-
 Morocco
-
 Mozambique
-
 Myanmar
-
 Namibia
-
 Nepal
Nepal
-
 Netherlands
-
 New Zealand
-
 Nigeria
-
 North Macedonia
-
 Norway
-
 Oman
Oman
-
 Pakistan
-
 Palestine
-
 Panama
-
 Papua New Guinea
-
 Paraguay
-
 Peru
Peru
-
 Philippines
-
 Poland
-
 Portugal
-
 Puerto Rico
-
 Qatar
Qatar
-
 Reunion
-
 Romania
-
 Rwanda
-
 Saudi Arabia
-
 Serbia
-
 Singapore
-
 Slovakia
-
 Slovenia
-
 Somalia
-
 South Africa
-
 Spain
Spain
-
 Sri Lanka
-
 Sweden
-
 Switzerland
-
 Syria
Syria
-
 Taiwan
-
 Tajikistan
-
 Tanzania
-
 Thailand
-
 Trinidad and Tobago
-
 Tunisia
-
 Turkey
-
 UAE
UAE
-
 Uganda
-
 Ukraine
-
 United Kingdom
-
United States
-
 Uruguay
-
 Uzbekistan
-
 Venezuela
-
 Vietnam
-
 Yemen
Yemen
-
 Zambia
-
 Zimbabwe
- Forex
- Crypto
