
Polkadot trades in lower recent range as sellers maintain control: weekly review

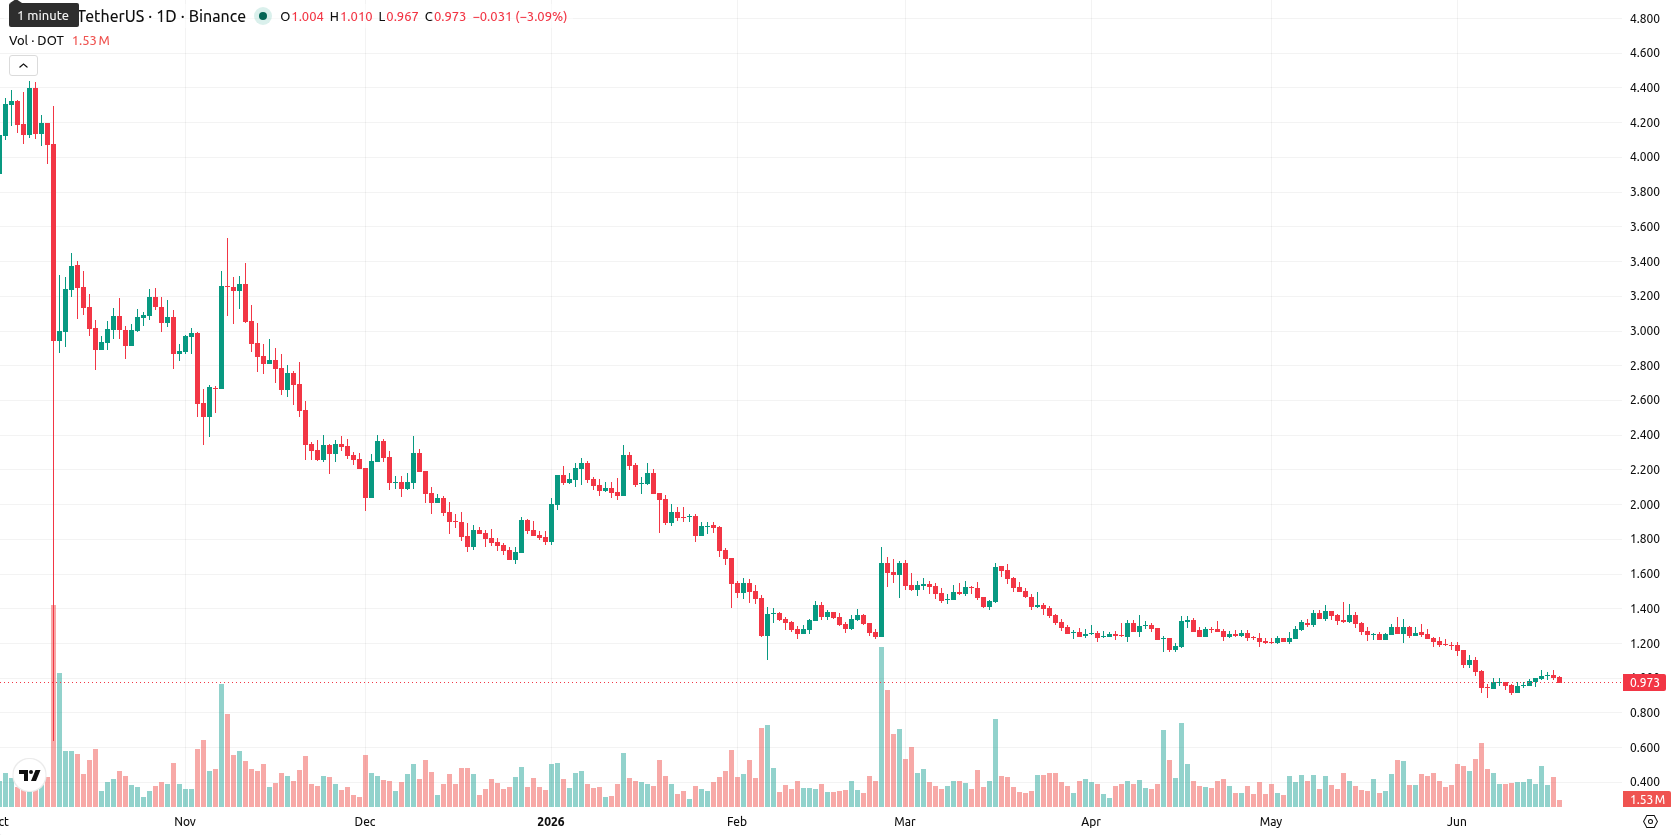
Polkadot (DOT) is currently trading at $0.975, reflecting a weekly gain of $0.0300 or 2.96%. The price remains significantly below its W1 MA-20 at $1.266, MA-50 at $2.370, and MA-200 at $4.934, highlighting a persistent bearish bias with prices positioned in the lower part of the weekly range.
Highlights
- Polkadot remains under significant selling pressure, consistently trading below key technical resistance levels despite a minor weekly rebound.
- Momentum indicators confirm a strong bearish trend, with sellers dominating and oversold signals emerging across multiple oscillators.
- DOT is expected to remain rangebound within $0.88 to $1.07, with a bearish break below $0.88 currently more probable than a recovery.
Bearish signals intensify over the week amid oversold conditions
Weekly technical analysis for DOT shows a notably bearish landscape: both the MACD and ADX on the W1 timeframe remain deeply in sell territory and underscore ongoing negative momentum. The RSI, Stoch RSI, and CCI indicators are registering oversold readings, suggesting that sellers control the market, even as DOT attempts a modest rebound. Weekly volatility stands at 11.26%, and key resistance levels are set at the MA-20 ($1.266) and MA-50 ($2.370), while immediate downside focus remains near recent lows.
Downside risk persists next week as technicals reinforce rangebound outlook
For the next 7 days, Polkadot is expected to trade in a range between $0.88 and $1.07, with the bias skewed towards further downside given that all four key W1 indicators remain bearish. The probability of a sustained move higher is less than 20% unless indicators shift decisively into neutral or buy signals. In the baseline scenario, DOT will likely remain rangebound, testing minor support and resistance; a bullish reversal would require a strong momentum shift above $1.07, while a break below $0.88 remains the path of least resistance in the current setup.
Earlier, analysts noted that Polkadot was exhibiting renewed bullish momentum amid a shift from persistent bearishness to potential consolidation. However, the latest weekly technical setup now signals robust downside risk, making a decisive move below $0.88 a key level to monitor for further deterioration.


Latest Polkadot News


-
 Afghanistan
-
 Albania
-
 Algeria
-
 Angola
-
 Argentina
-
 Armenia
-
 Australia
-
 Austria
-
 Azerbaijan
-
 Bahamas
-
 Bahrain
-
 Bangladesh
-
 Belarus
-
 Belgium
-
 Bolivia
-
 Botswana
-
 Brazil
-
 Brunei
-
 Bulgaria
-
 Cambodia
-
 Cameroon
-
 Canada
-
 Chile
Chile
-
 China
China
-
 Colombia
-
 Congo
Congo
-
 Costa Rica
-
 Cote d'Ivoire
-
 Croatia
-
 Cuba
Cuba
-
 Cyprus
-
 Czechia
-
 DR Congo
-
 Denmark
-
 Dominican Republic
-
 Ecuador
-
 Egypt
Egypt
-
 El Salvador
-
 Estonia
-
 Eswatini
-
 Ethiopia
-
 Finland
-
 France
-
 Georgia
-
 Germany
-
 Ghana
Ghana
-
 Greece
-
 Haiti
Haiti
-
 Hong Kong
-
 Hungary
-
 India
India
-
 Indonesia
-
 Iran, Islamic republic
-
 Iraq
Iraq
-
 Ireland
-
 Israel
-
 Italy
Italy
-
 Jamaica
-
 Japan
Japan
-
 Jordan
-
 Kazakhstan
-
 Kenya
Kenya
-
 Korea
Korea
-
 Kuwait
-
 Kyrgyzstan
-
 Laos
Laos
-
 Latvia
-
 Lebanon
-
 Lesotho
-
 Libya
Libya
-
 Lithuania
-
 Luxembourg
-
 Madagascar
-
 Malaysia
-
 Malta
Malta
-
 Mauritius
-
 Mexico
-
 Moldova
-
 Mongolia
-
 Montenegro
-
 Morocco
-
 Mozambique
-
 Myanmar
-
 Namibia
-
 Nepal
Nepal
-
 Netherlands
-
 New Zealand
-
 Nigeria
-
 North Macedonia
-
 Norway
-
 Oman
Oman
-
 Pakistan
-
 Palestine
-
 Panama
-
 Papua New Guinea
-
 Paraguay
-
 Peru
Peru
-
 Philippines
-
 Poland
-
 Portugal
-
 Puerto Rico
-
 Qatar
Qatar
-
 Reunion
-
 Romania
-
 Rwanda
-
 Saudi Arabia
-
 Serbia
-
 Singapore
-
 Slovakia
-
 Slovenia
-
 Somalia
-
 South Africa
-
 Spain
Spain
-
 Sri Lanka
-
 Sweden
-
 Switzerland
-
 Syria
Syria
-
 Taiwan
-
 Tajikistan
-
 Tanzania
-
 Thailand
-
 Trinidad and Tobago
-
 Tunisia
-
 Turkey
-
 UAE
UAE
-
 Uganda
-
 Ukraine
-
 United Kingdom
-
United States
-
 Uruguay
-
 Uzbekistan
-
 Venezuela
-
 Vietnam
-
 Yemen
Yemen
-
 Zambia
-
 Zimbabwe
- Forex
- Crypto
