
Shiba Inu falls 6.99% as Shibarium Layer-2 faces $4 million security breach

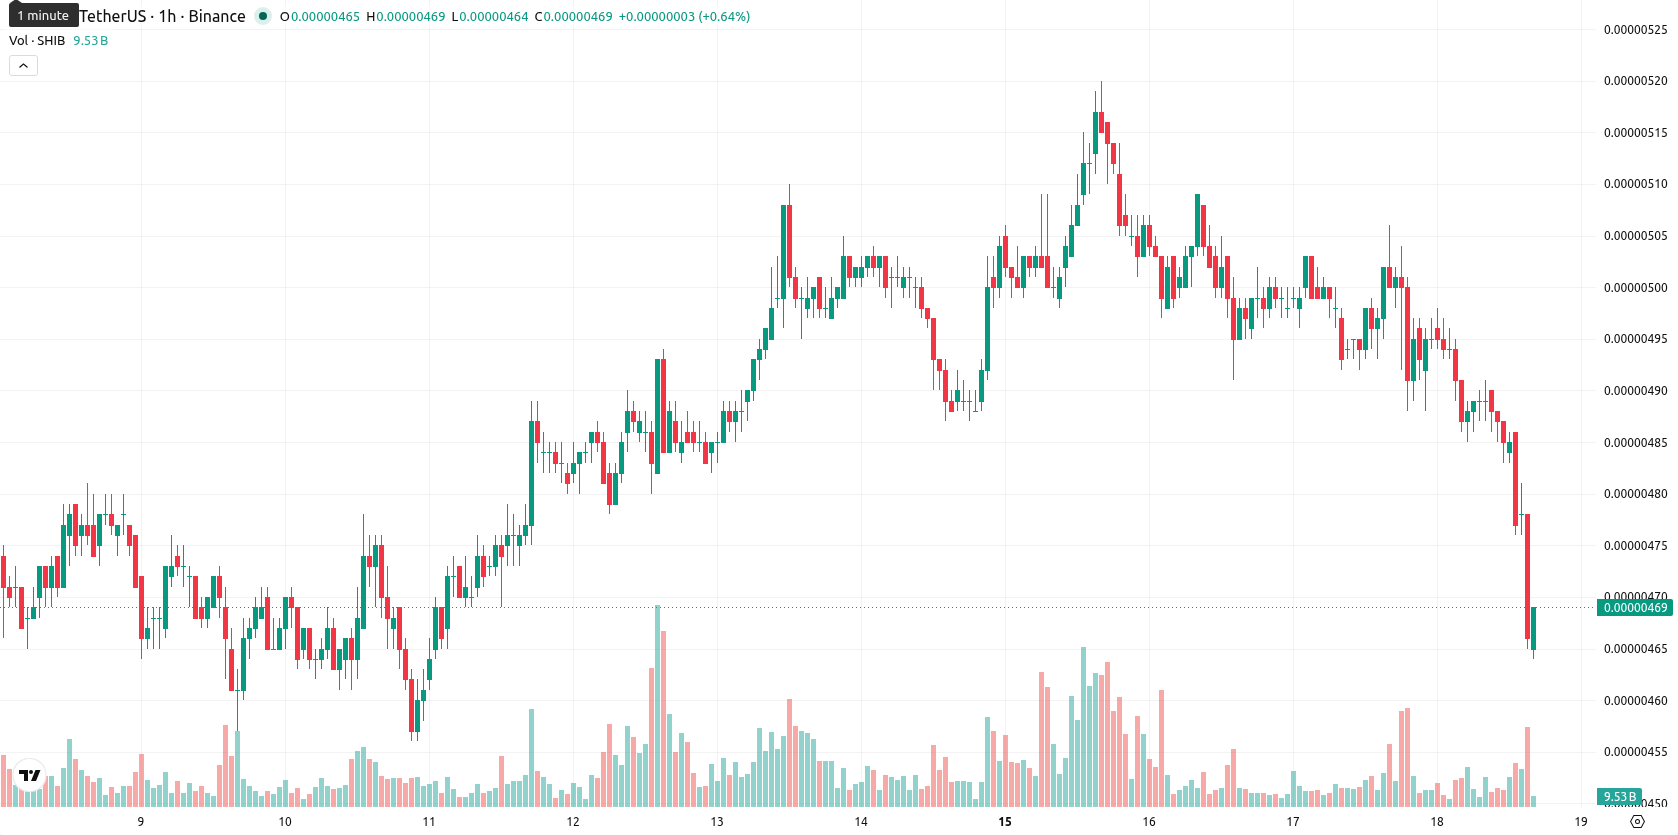
Shiba Inu (SHIB) is trading at $0.0000047, marking a daily decline of 6.99%. The price sits below its key moving averages, indicating persistent downward momentum in the short and medium terms.
Highlights
- A multi-asset crypto ETF has been approved, potentially enabling institutional access to SHIB under regulated conditions.
- Investor sentiment remains cautious after last year's $4 million Shibarium breach, with renewed concern as over 25 billion SHIB tokens returned to exchanges.
- SHIB exhibits pronounced downside momentum, trading below key averages with strong sell signals and a high probability of remaining between $0.00000461 and $0.00000493 near-term.
Protocol safety and token outflows drive worsening sentiment after ETF boost
Shiba Inu's official X account reported that a multi-asset crypto ETF had been approved which could include SHIB among its eligible assets, expanding potential regulated access for institutional participants. Following the significant security breach on Shibarium's Layer-2 last year, in which over $4 million was stolen, persistent concerns regarding protocol safety have colored investor sentiment. SHIB's market status has also shifted as MemeCore (M) overtook it in memecoin rankings, while recent on-chain data showed more than 25 billion tokens were recently sent back to exchanges, increasing the available supply.
Bearish momentum confirmed as oversold indicators and resistance align
On the hourly chart, SHIB/USD remains below both its 20-period moving average at $0.00000488 and its 50-period moving average at $0.00000494, while trading well below the 200-period moving average from the daily timeframe at $0.00000654. The Ichimoku Kijun line on the daily chart sets immediate resistance at $0.00000487. Momentum indicators are firmly negative: MACD and ADX both reinforce a sell bias, RSI stands at 22.2 in deep oversold territory, and both Stochastic RSI and CCI also signal oversold conditions. BBP readings confirm dominant seller pressure, with the Awesome Oscillator supporting ongoing bearish momentum.
Low recovery odds as range-bound trade signals further downside risk
In the coming 1–2 trading days, SHIB/USD is expected to range between $0.00000461 and $0.00000493, reflecting the typical volatility band relative to current levels. With a very low probability of an upward move and a high chance of further downside, a recovery appears unlikely in the short term. The baseline scenario calls for price consolidation within this range, while a bullish scenario would require a breakout above the $0.00000487 resistance. On the bearish side, failure to hold support at $0.00000461 could lead to an extension of recent losses.
Earlier, analysts noted that Shiba Inu was struggling to overcome persistent bearish momentum, with sellers maintaining control despite periods of speculative trading activity. The latest technical signals and widened institutional access reinforce this negative outlook, making sustained price pressure likely until a decisive break above $0.00000487 shifts the short-term scenario.


-
 Afghanistan
-
 Albania
-
 Algeria
-
 Angola
-
 Argentina
-
 Armenia
-
 Australia
-
 Austria
-
 Azerbaijan
-
 Bahamas
-
 Bahrain
-
 Bangladesh
-
 Belarus
-
 Belgium
-
 Bolivia
-
 Botswana
-
 Brazil
-
 Brunei
-
 Bulgaria
-
 Cambodia
-
 Cameroon
-
 Canada
-
 Chile
Chile
-
 China
China
-
 Colombia
-
 Congo
Congo
-
 Costa Rica
-
 Cote d'Ivoire
-
 Croatia
-
 Cuba
Cuba
-
 Cyprus
-
 Czechia
-
 DR Congo
-
 Denmark
-
 Dominican Republic
-
 Ecuador
-
 Egypt
Egypt
-
 El Salvador
-
 Estonia
-
 Eswatini
-
 Ethiopia
-
 Finland
-
 France
-
 Georgia
-
 Germany
-
 Ghana
Ghana
-
 Greece
-
 Haiti
Haiti
-
 Hong Kong
-
 Hungary
-
 India
India
-
 Indonesia
-
 Iran, Islamic republic
-
 Iraq
Iraq
-
 Ireland
-
 Israel
-
 Italy
Italy
-
 Jamaica
-
 Japan
Japan
-
 Jordan
-
 Kazakhstan
-
 Kenya
Kenya
-
 Korea
Korea
-
 Kuwait
-
 Kyrgyzstan
-
 Laos
Laos
-
 Latvia
-
 Lebanon
-
 Lesotho
-
 Libya
Libya
-
 Lithuania
-
 Luxembourg
-
 Madagascar
-
 Malaysia
-
 Malta
Malta
-
 Mauritius
-
 Mexico
-
 Moldova
-
 Mongolia
-
 Montenegro
-
 Morocco
-
 Mozambique
-
 Myanmar
-
 Namibia
-
 Nepal
Nepal
-
 Netherlands
-
 New Zealand
-
 Nigeria
-
 North Macedonia
-
 Norway
-
 Oman
Oman
-
 Pakistan
-
 Palestine
-
 Panama
-
 Papua New Guinea
-
 Paraguay
-
 Peru
Peru
-
 Philippines
-
 Poland
-
 Portugal
-
 Puerto Rico
-
 Qatar
Qatar
-
 Reunion
-
 Romania
-
 Rwanda
-
 Saudi Arabia
-
 Serbia
-
 Singapore
-
 Slovakia
-
 Slovenia
-
 Somalia
-
 South Africa
-
 Spain
Spain
-
 Sri Lanka
-
 Sweden
-
 Switzerland
-
 Syria
Syria
-
 Taiwan
-
 Tajikistan
-
 Tanzania
-
 Thailand
-
 Trinidad and Tobago
-
 Tunisia
-
 Turkey
-
 UAE
UAE
-
 Uganda
-
 Ukraine
-
 United Kingdom
-
United States
-
 Uruguay
-
 Uzbekistan
-
 Venezuela
-
 Vietnam
-
 Yemen
Yemen
-
 Zambia
-
 Zimbabwe
- Forex
- Crypto
