
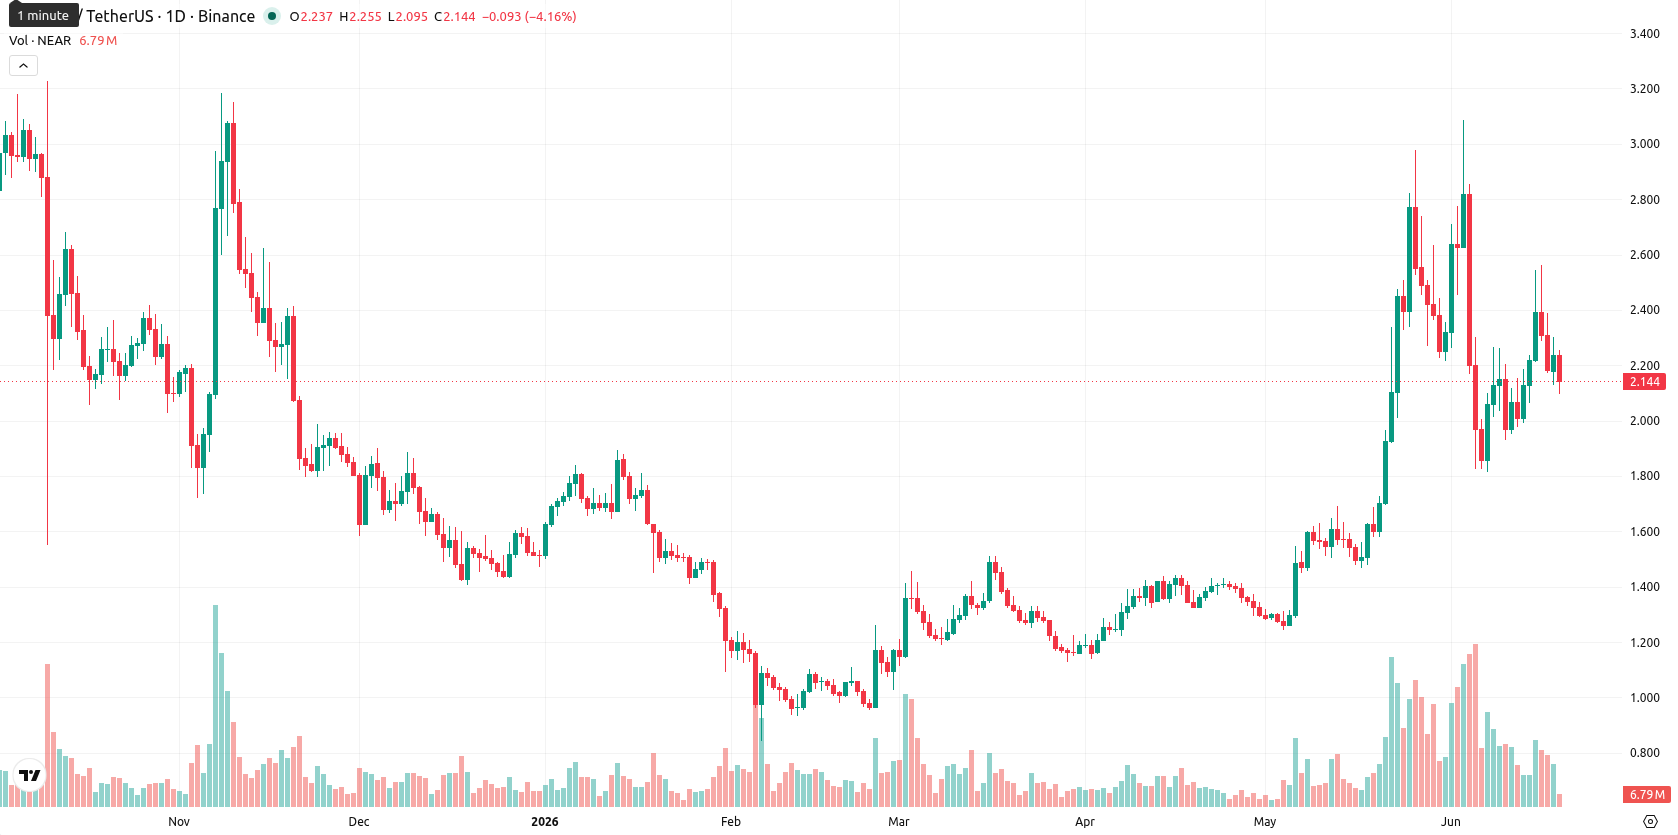
NEAR climbs within recent $2.14 to $2.58 range as oscillators remain neutral: weekly analysis

NEAR is currently trading above both the weekly MA-20 ($1.5057) and MA-50 ($1.9576), but remains below the MA-200 ($3.0014). Over the last seven days, NEAR has advanced by $0.088 (4.37%), finishing this week in the lower part of its established range.
Highlights
- NEAR maintains positive medium-term momentum, but long-term resistance limits further upside as it trades below a key technical barrier.
- High weekly volatility at 28.74% and overbought signals indicate increased risk of short-term corrective moves or consolidation.
- NEAR is expected to consolidate between $2.14 and $2.58 this week, with only a 25% chance of a decisive breakout above resistance.
Bullish price structure persists despite mixed momentum indicators this week
On the weekly (W1) timeframe, NEAR maintains a positive medium-term structure, supported by its position above the 20- and 50-week moving averages, while persistent resistance remains just under the 200-week MA. Support and resistance for the week are identified at $2.14 and $2.58, respectively. Momentum readings are mixed: the MACD and ADX remain neutral, the weekly RSI signals bullish sentiment in buy territory, and Bull/Bear Power is strong but overbought. Weekly oscillators, including the CCI and Stochastic RSI, generally indicate neutral conditions, though the Awesome Oscillator suggests the bulls could maintain short-term control if follow-through emerges.
Consolidation likely as weekly signals diverge on breakout risks
For the next seven days, NEAR is expected to fluctuate within a $2.14 to $2.58 range as weekly momentum shows no clear consensus. Only one out of four major weekly signals (RSI) suggests further upside, meaning the probability of a bullish breakout is just 25%. The baseline scenario is consolidation between support and resistance, but a close above $2.58 would open up the chance for additional gains if volume and buying persist. Conversely, a drop below $2.14 could trigger a further pullback with the $2.00 area emerging as a near-term support zone.
Earlier, analysts noted that NEAR was shifting toward sustained bearish momentum amid heightened selling pressure. The current outlook introduces a more neutral, consolidative phase, with the next decisive move likely hinging on whether NEAR can firmly break above $2.58 resistance or risks further retracement below $2.14 support.


Latest NEAR News


-
 Afghanistan
-
 Albania
-
 Algeria
-
 Angola
-
 Argentina
-
 Armenia
-
 Australia
-
 Austria
-
 Azerbaijan
-
 Bahamas
-
 Bahrain
-
 Bangladesh
-
 Belarus
-
 Belgium
-
 Bolivia
-
 Botswana
-
 Brazil
-
 Brunei
-
 Bulgaria
-
 Cambodia
-
 Cameroon
-
 Canada
-
 Chile
Chile
-
 China
China
-
 Colombia
-
 Congo
Congo
-
 Costa Rica
-
 Cote d'Ivoire
-
 Croatia
-
 Cuba
Cuba
-
 Cyprus
-
 Czechia
-
 DR Congo
-
 Denmark
-
 Dominican Republic
-
 Ecuador
-
 Egypt
Egypt
-
 El Salvador
-
 Estonia
-
 Eswatini
-
 Ethiopia
-
 Finland
-
 France
-
 Georgia
-
 Germany
-
 Ghana
Ghana
-
 Greece
-
 Haiti
Haiti
-
 Hong Kong
-
 Hungary
-
 India
India
-
 Indonesia
-
 Iran, Islamic republic
-
 Iraq
Iraq
-
 Ireland
-
 Israel
-
 Italy
Italy
-
 Jamaica
-
 Japan
Japan
-
 Jordan
-
 Kazakhstan
-
 Kenya
Kenya
-
 Korea
Korea
-
 Kuwait
-
 Kyrgyzstan
-
 Laos
Laos
-
 Latvia
-
 Lebanon
-
 Lesotho
-
 Libya
Libya
-
 Lithuania
-
 Luxembourg
-
 Madagascar
-
 Malaysia
-
 Malta
Malta
-
 Mauritius
-
 Mexico
-
 Moldova
-
 Mongolia
-
 Montenegro
-
 Morocco
-
 Mozambique
-
 Myanmar
-
 Namibia
-
 Nepal
Nepal
-
 Netherlands
-
 New Zealand
-
 Nigeria
-
 North Macedonia
-
 Norway
-
 Oman
Oman
-
 Pakistan
-
 Palestine
-
 Panama
-
 Papua New Guinea
-
 Paraguay
-
 Peru
Peru
-
 Philippines
-
 Poland
-
 Portugal
-
 Puerto Rico
-
 Qatar
Qatar
-
 Reunion
-
 Romania
-
 Rwanda
-
 Saudi Arabia
-
 Serbia
-
 Singapore
-
 Slovakia
-
 Slovenia
-
 Somalia
-
 South Africa
-
 Spain
Spain
-
 Sri Lanka
-
 Sweden
-
 Switzerland
-
 Syria
Syria
-
 Taiwan
-
 Tajikistan
-
 Tanzania
-
 Thailand
-
 Trinidad and Tobago
-
 Tunisia
-
 Turkey
-
 UAE
UAE
-
 Uganda
-
 Ukraine
-
 United Kingdom
-
United States
-
 Uruguay
-
 Uzbekistan
-
 Venezuela
-
 Vietnam
-
 Yemen
Yemen
-
 Zambia
-
 Zimbabwe
- Forex
- Crypto
