
-8.2% for Optimism amid limited downside from oversold conditions

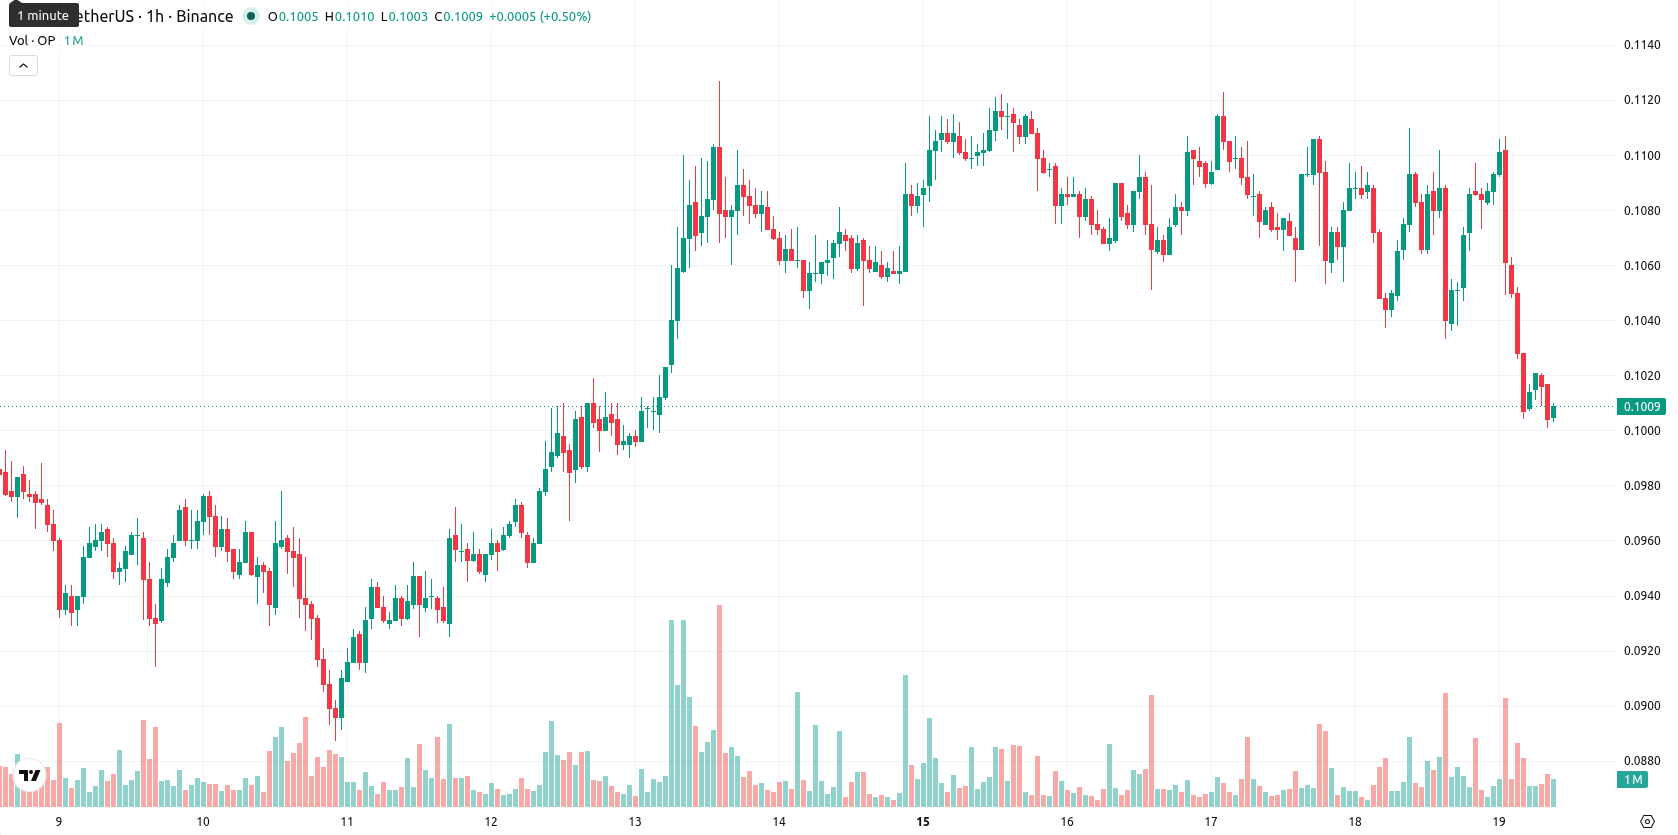
Optimism (OP) is trading at $0.1007, down 8.2% on the day. The asset is positioned below its key moving averages, with persistent downside momentum evident.
Highlights
- OP/USD remains under persistent selling pressure, trading below key moving averages across all major timeframes.
- Momentum and volatility indicators collectively confirm a prevailing bearish bias, with oversold signals dominating the market outlook.
- Price is expected to consolidate between $0.0977 and $0.1122 over the next 2–3 days, with further downside likely unless resistance is breached.
Oversold conditions and resistance cap OP amid seller dominance
OP/USD is trading below the MA-20 ($0.1056) and MA-50 ($0.1068) on the hourly chart, as well as below the MA-200 ($0.1836) on the daily timeframe. The Ichimoku Kijun level at $0.1057 is acting as immediate resistance, while the expected range for the next 2–3 trading days is $0.0977 to $0.1122. Momentum indicators such as the MACD signal a sell, ADX is neutral, and the RSI, Stoch RSI, and CCI all indicate oversold conditions. BBP also points to dominance by sellers, and the Awesome Oscillator confirms the prevailing downside bias.
Range-bound trading likely as resistance caps breakout potential
OP/USD is likely to consolidate within the $0.0977 to $0.1122 range over the next several sessions, reflecting a typical volatility band relative to current levels. The probability of an upward breakout is very low without a move above the immediate resistance. Should the price drop below local support, further declines may follow, while a bullish scenario would require overcoming the resistance marked by the Ichimoku Kijun.
Earlier, analysts noted that Optimism was exhibiting sustained bearish momentum, with technical signals favoring ongoing seller control. This view is reinforced by current price action and momentum indicators, suggesting traders should monitor for a potential volatility expansion if the $0.0977 support or $0.1122 resistance are decisively breached in the coming sessions.


-
 Afghanistan
-
 Albania
-
 Algeria
-
 Angola
-
 Argentina
-
 Armenia
-
 Australia
-
 Austria
-
 Azerbaijan
-
 Bahamas
-
 Bahrain
-
 Bangladesh
-
 Belarus
-
 Belgium
-
 Bolivia
-
 Botswana
-
 Brazil
-
 Brunei
-
 Bulgaria
-
 Cambodia
-
 Cameroon
-
 Canada
-
 Chile
Chile
-
 China
China
-
 Colombia
-
 Congo
Congo
-
 Costa Rica
-
 Cote d'Ivoire
-
 Croatia
-
 Cuba
Cuba
-
 Cyprus
-
 Czechia
-
 DR Congo
-
 Denmark
-
 Dominican Republic
-
 Ecuador
-
 Egypt
Egypt
-
 El Salvador
-
 Estonia
-
 Eswatini
-
 Ethiopia
-
 Finland
-
 France
-
 Georgia
-
 Germany
-
 Ghana
Ghana
-
 Greece
-
 Haiti
Haiti
-
 Hong Kong
-
 Hungary
-
 India
India
-
 Indonesia
-
 Iran, Islamic republic
-
 Iraq
Iraq
-
 Ireland
-
 Israel
-
 Italy
Italy
-
 Jamaica
-
 Japan
Japan
-
 Jordan
-
 Kazakhstan
-
 Kenya
Kenya
-
 Korea
Korea
-
 Kuwait
-
 Kyrgyzstan
-
 Laos
Laos
-
 Latvia
-
 Lebanon
-
 Lesotho
-
 Libya
Libya
-
 Lithuania
-
 Luxembourg
-
 Madagascar
-
 Malaysia
-
 Malta
Malta
-
 Mauritius
-
 Mexico
-
 Moldova
-
 Mongolia
-
 Montenegro
-
 Morocco
-
 Mozambique
-
 Myanmar
-
 Namibia
-
 Nepal
Nepal
-
 Netherlands
-
 New Zealand
-
 Nigeria
-
 North Macedonia
-
 Norway
-
 Oman
Oman
-
 Pakistan
-
 Palestine
-
 Panama
-
 Papua New Guinea
-
 Paraguay
-
 Peru
Peru
-
 Philippines
-
 Poland
-
 Portugal
-
 Puerto Rico
-
 Qatar
Qatar
-
 Reunion
-
 Romania
-
 Rwanda
-
 Saudi Arabia
-
 Serbia
-
 Singapore
-
 Slovakia
-
 Slovenia
-
 Somalia
-
 South Africa
-
 Spain
Spain
-
 Sri Lanka
-
 Sweden
-
 Switzerland
-
 Syria
Syria
-
 Taiwan
-
 Tajikistan
-
 Tanzania
-
 Thailand
-
 Trinidad and Tobago
-
 Tunisia
-
 Turkey
-
 UAE
UAE
-
 Uganda
-
 Ukraine
-
 United Kingdom
-
United States
-
 Uruguay
-
 Uzbekistan
-
 Venezuela
-
 Vietnam
-
 Yemen
Yemen
-
 Zambia
-
 Zimbabwe
- Forex
- Crypto
