
Sui pressured near bottom of recent range amid oversold RSI conditions: weekly analysis

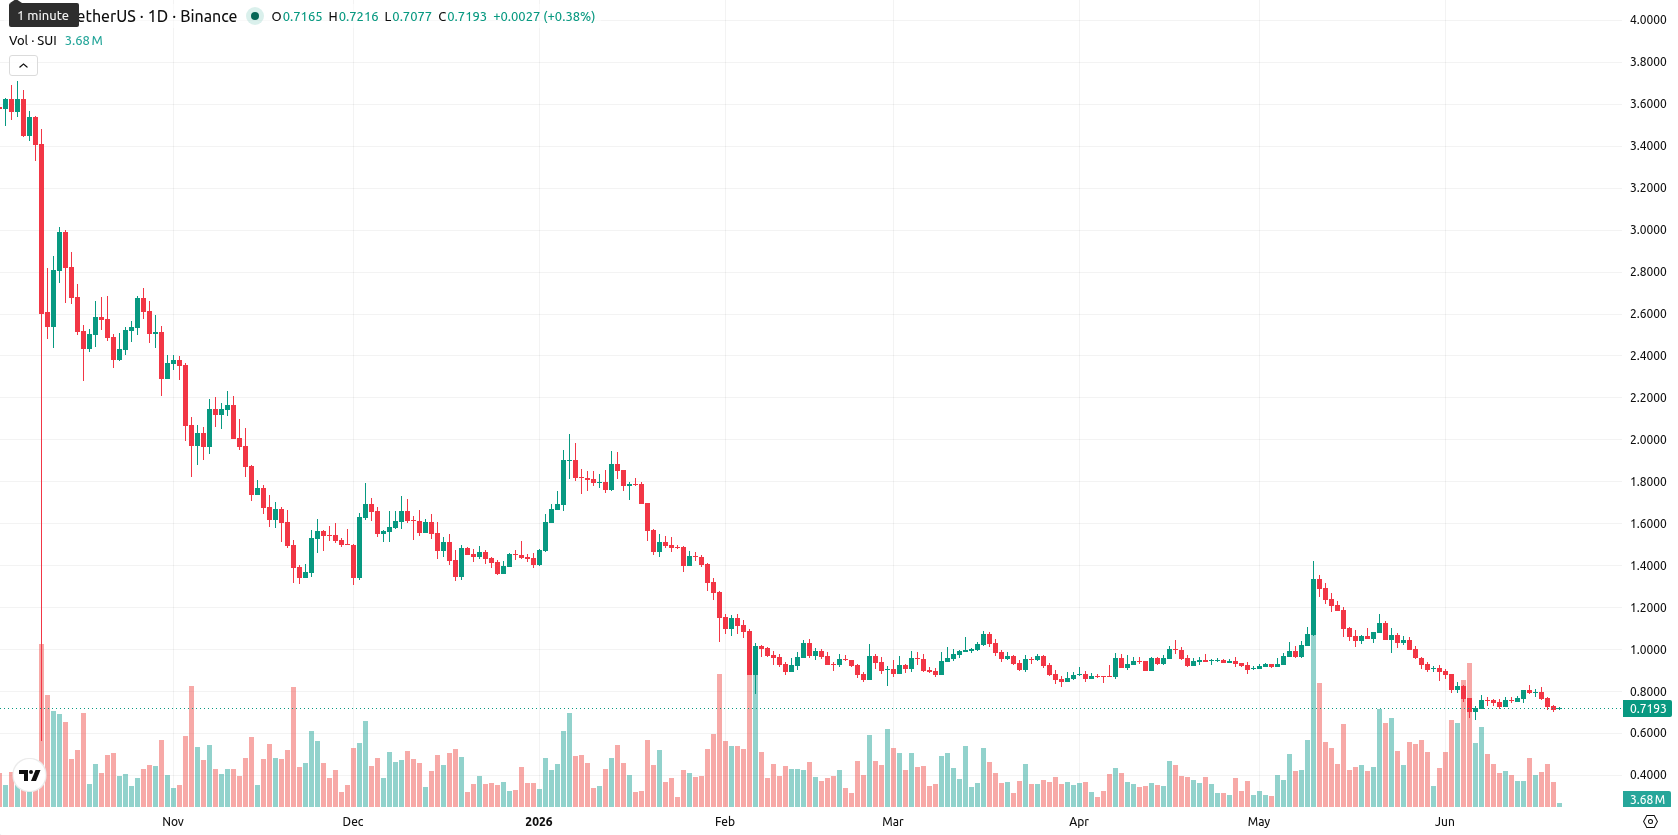
Sui (SUI) is currently trading at $0.7188, having declined $0.0329 or 4.35% over the last week. The price remains well below both its weekly MA-20 at $0.9278 and MA-50 at $1.9328, reinforcing persistent downward pressure from sellers on the weekly chart.
Highlights
- SUI remains under sustained selling pressure, trading well below key moving averages and lacking any technical signs of reversal.
- Bearish momentum dominates, with indicators signaling oversold conditions and buyer weakness, suggesting limited upside prospects in the near term.
- SUI is expected to consolidate between $0.574 and $0.863 over the next week, with downside risk prevailing if bearish momentum persists.
Momentum weakens further as bearish signals dominate technicals this week
Weekly technical factors remain firmly bearish for SUI. The price sits at the very bottom of its weekly range and is notably under both the MA-20 and MA-50, with the MA-20 acting as dynamic resistance. The Ichimoku Kijun also stands above current levels, confirming a negative trend. Momentum is strongly negative as supported by weak MACD, ADX, and a sell-zone RSI, while both the CCI and Stochastic RSI signal oversold conditions and a lack of buyer dominance.
Consolidation expected next week as downside risk outweighs rebound prospects
Looking ahead over the next 7 days, SUI is forecast to trade in a rough range between $0.574 and $0.863 based on current weekly volatility. None of the four key weekly indicators suggest a buy, which points to a low rebound probability and increased risk of further downside. The baseline scenario is for consolidated, sideways movement near present levels. A return of bullish momentum could set up a test of resistance near $0.86, while persistent selling may drive SUI toward support at $0.57 or below.
Previously it was reported that Sui faced broad-based selling pressure, with technical signals reinforcing a bearish outlook. The current analysis reinforces this negative sentiment, highlighting persistently weak momentum and suggesting that SUI traders should closely monitor for further downside risk amid limited signs of imminent recovery.


-
 Afghanistan
-
 Albania
-
 Algeria
-
 Angola
-
 Argentina
-
 Armenia
-
 Australia
-
 Austria
-
 Azerbaijan
-
 Bahamas
-
 Bahrain
-
 Bangladesh
-
 Belarus
-
 Belgium
-
 Bolivia
-
 Botswana
-
 Brazil
-
 Brunei
-
 Bulgaria
-
 Cambodia
-
 Cameroon
-
 Canada
-
 Chile
Chile
-
 China
China
-
 Colombia
-
 Congo
Congo
-
 Costa Rica
-
 Cote d'Ivoire
-
 Croatia
-
 Cuba
Cuba
-
 Cyprus
-
 Czechia
-
 DR Congo
-
 Denmark
-
 Dominican Republic
-
 Ecuador
-
 Egypt
Egypt
-
 El Salvador
-
 Estonia
-
 Eswatini
-
 Ethiopia
-
 Finland
-
 France
-
 Georgia
-
 Germany
-
 Ghana
Ghana
-
 Greece
-
 Haiti
Haiti
-
 Hong Kong
-
 Hungary
-
 India
India
-
 Indonesia
-
 Iran, Islamic republic
-
 Iraq
Iraq
-
 Ireland
-
 Israel
-
 Italy
Italy
-
 Jamaica
-
 Japan
Japan
-
 Jordan
-
 Kazakhstan
-
 Kenya
Kenya
-
 Korea
Korea
-
 Kuwait
-
 Kyrgyzstan
-
 Laos
Laos
-
 Latvia
-
 Lebanon
-
 Lesotho
-
 Libya
Libya
-
 Lithuania
-
 Luxembourg
-
 Madagascar
-
 Malaysia
-
 Malta
Malta
-
 Mauritius
-
 Mexico
-
 Moldova
-
 Mongolia
-
 Montenegro
-
 Morocco
-
 Mozambique
-
 Myanmar
-
 Namibia
-
 Nepal
Nepal
-
 Netherlands
-
 New Zealand
-
 Nigeria
-
 North Macedonia
-
 Norway
-
 Oman
Oman
-
 Pakistan
-
 Palestine
-
 Panama
-
 Papua New Guinea
-
 Paraguay
-
 Peru
Peru
-
 Philippines
-
 Poland
-
 Portugal
-
 Puerto Rico
-
 Qatar
Qatar
-
 Reunion
-
 Romania
-
 Rwanda
-
 Saudi Arabia
-
 Serbia
-
 Singapore
-
 Slovakia
-
 Slovenia
-
 Somalia
-
 South Africa
-
 Spain
Spain
-
 Sri Lanka
-
 Sweden
-
 Switzerland
-
 Syria
Syria
-
 Taiwan
-
 Tajikistan
-
 Tanzania
-
 Thailand
-
 Trinidad and Tobago
-
 Tunisia
-
 Turkey
-
 UAE
UAE
-
 Uganda
-
 Ukraine
-
 United Kingdom
-
United States
-
 Uruguay
-
 Uzbekistan
-
 Venezuela
-
 Vietnam
-
 Yemen
Yemen
-
 Zambia
-
 Zimbabwe
- Forex
- Crypto
