
UNI edges higher with resistance forming near $3.25: weekly forecast

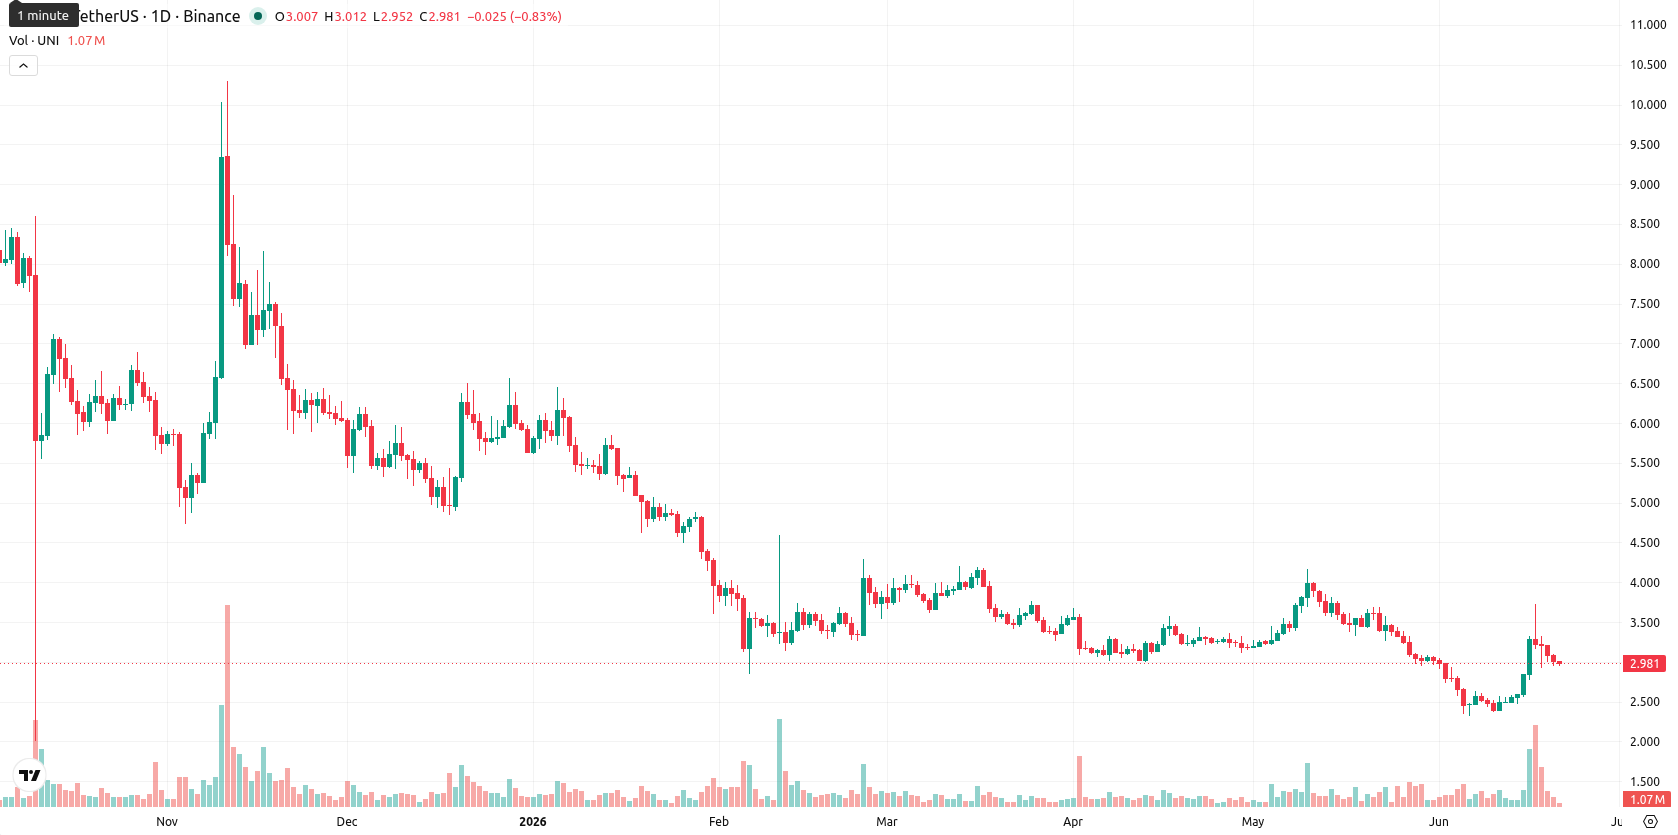
Uniswap (UNI) is currently trading at $2.98, reflecting a weekly gain of $0.44 or 17.31%. Over the past week, UNI remained well below its weekly MA-20 at $3.3352, MA-50 at $5.83, and MA-200 at $6.8726, highlighting persistent medium- and long-term downside pressure.
Highlights
- UNI remains below key moving averages, reflecting sustained medium- and long-term downside momentum despite recent rebound.
- Momentum indicators are broadly bearish or neutral, signaling weak trend strength and dominant selling pressure even after a brief recovery.
- UNI is likely to consolidate between $2.75 and $3.25 with less than 20% probability of an upside breakout this week.
Consolidation zone persists as technicals turn bearish to neutral
On the weekly (W1) chart, UNI continues to face resistance from its MA-20 at $3.3352, with the price stabilizing below the MA-50 and MA-200. Support is established around $2.75, while resistance is near $3.25, forming a consolidation zone. Weekly indicators present a bearish to neutral picture: the MACD shows a strong sell, ADX is neutral (signaling weak trend strength), and both RSI and Commodity Channel Index reside in the 'Sell' zone. The Bull/Bear Power indicates oversold conditions, while Stochastic RSI provides a rare 'Strong Buy' counter-signal, suggesting technical rebound risk amid broader selling.
Sideways bias likely as resistance and weak momentum limit upside
For the next 7 days, UNI is expected to trade within a range of $2.75 to $3.25, with low odds of a breakout in either direction. The base case scenario is sideways consolidation, with brief rebounds possible but capped by resistance at $3.25 and pressured by dynamic resistance from the MA-20. Should selling pressure return, UNI could test support at $2.75. In the less likely bullish scenario, conviction above $3.25 may invite further recovery, but confirmation from weekly indicators is currently lacking.
Earlier, analysts noted that Uniswap was experiencing mixed technical momentum and subdued upside prospects despite encouraging regulatory signals. Fresh weekly data reinforces this cautious outlook, with continued consolidation below major moving averages and a prevailing risk of further volatility should support at $2.75 come under renewed pressure.


-
 Afghanistan
-
 Albania
-
 Algeria
-
 Angola
-
 Argentina
-
 Armenia
-
 Australia
-
 Austria
-
 Azerbaijan
-
 Bahamas
-
 Bahrain
-
 Bangladesh
-
 Belarus
-
 Belgium
-
 Bolivia
-
 Botswana
-
 Brazil
-
 Brunei
-
 Bulgaria
-
 Cambodia
-
 Cameroon
-
 Canada
-
 Chile
Chile
-
 China
China
-
 Colombia
-
 Congo
Congo
-
 Costa Rica
-
 Cote d'Ivoire
-
 Croatia
-
 Cuba
Cuba
-
 Cyprus
-
 Czechia
-
 DR Congo
-
 Denmark
-
 Dominican Republic
-
 Ecuador
-
 Egypt
Egypt
-
 El Salvador
-
 Estonia
-
 Eswatini
-
 Ethiopia
-
 Finland
-
 France
-
 Georgia
-
 Germany
-
 Ghana
Ghana
-
 Greece
-
 Haiti
Haiti
-
 Hong Kong
-
 Hungary
-
 India
India
-
 Indonesia
-
 Iran, Islamic republic
-
 Iraq
Iraq
-
 Ireland
-
 Israel
-
 Italy
Italy
-
 Jamaica
-
 Japan
Japan
-
 Jordan
-
 Kazakhstan
-
 Kenya
Kenya
-
 Korea
Korea
-
 Kuwait
-
 Kyrgyzstan
-
 Laos
Laos
-
 Latvia
-
 Lebanon
-
 Lesotho
-
 Libya
Libya
-
 Lithuania
-
 Luxembourg
-
 Madagascar
-
 Malaysia
-
 Malta
Malta
-
 Mauritius
-
 Mexico
-
 Moldova
-
 Mongolia
-
 Montenegro
-
 Morocco
-
 Mozambique
-
 Myanmar
-
 Namibia
-
 Nepal
Nepal
-
 Netherlands
-
 New Zealand
-
 Nigeria
-
 North Macedonia
-
 Norway
-
 Oman
Oman
-
 Pakistan
-
 Palestine
-
 Panama
-
 Papua New Guinea
-
 Paraguay
-
 Peru
Peru
-
 Philippines
-
 Poland
-
 Portugal
-
 Puerto Rico
-
 Qatar
Qatar
-
 Reunion
-
 Romania
-
 Rwanda
-
 Saudi Arabia
-
 Serbia
-
 Singapore
-
 Slovakia
-
 Slovenia
-
 Somalia
-
 South Africa
-
 Spain
Spain
-
 Sri Lanka
-
 Sweden
-
 Switzerland
-
 Syria
Syria
-
 Taiwan
-
 Tajikistan
-
 Tanzania
-
 Thailand
-
 Trinidad and Tobago
-
 Tunisia
-
 Turkey
-
 UAE
UAE
-
 Uganda
-
 Ukraine
-
 United Kingdom
-
United States
-
 Uruguay
-
 Uzbekistan
-
 Venezuela
-
 Vietnam
-
 Yemen
Yemen
-
 Zambia
-
 Zimbabwe
- Forex
- Crypto
