
QNT consolidates within recent range with bearish technical momentum: weekly review

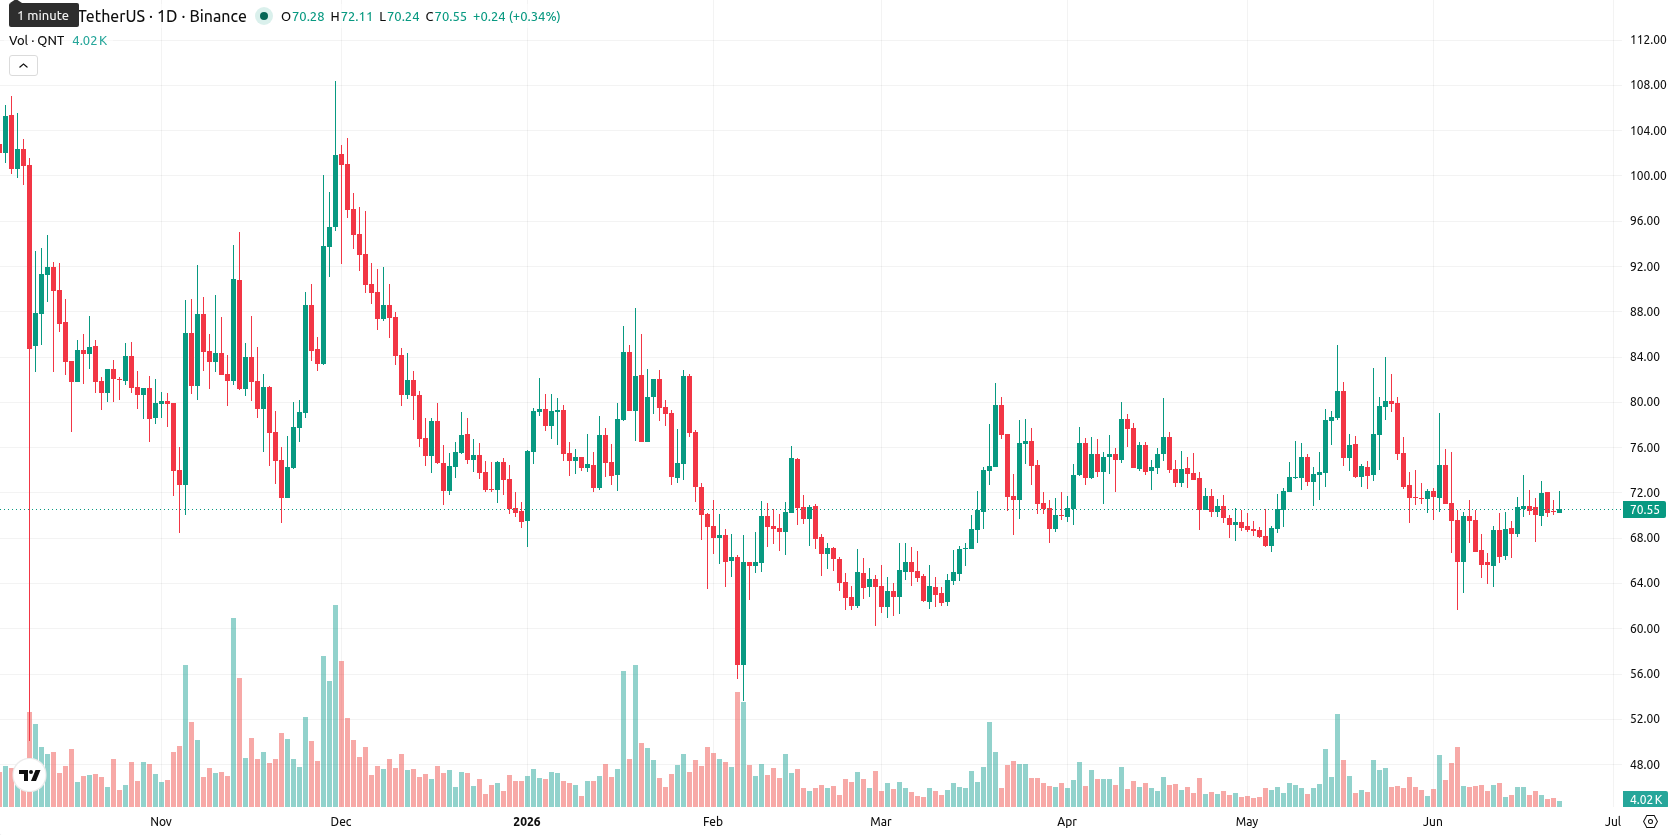
Quant (QNT) is trading at $70.46, having gained $0.83 (1.22%) over the past week. The asset sits just above its weekly MA-20 ($70.233), but remains well below the MA-50 ($83.7692) and MA-200 ($98.5084), signaling persistent medium- and long-term selling pressure. On the weekly chart, QNT currently occupies the middle of its recent range.
Highlights
- QNT remains under both medium- and long-term pressure, trading below key moving averages and consolidating within a defined range.
- Momentum indicators suggest a prevailing bearish bias, with weak trend strength and limited signals for potential reversal.
- The expected seven-day price range stands at $67.60 to $73.30, with a breakout above $73.30 unlikely and sideways movement the base scenario.
Bearish momentum persists over the week amid persistent technical weakness
On the weekly timeframe, QNT’s technical outlook remains weak. The price is slightly above the MA-20 but continues to trade notably below the MA-50 and MA-200, confirming a larger bearish context. The Ichimoku Kijun is very close to the current price and is acting as a short-term pivot. Key indicators show the MACD on a strong sell, ADX neutral, and RSI on a sell bias, with the Stochastic RSI and CCI neutral. Bull/Bear Power is overbought, and the Awesome Oscillator supports ongoing downside momentum. Weekly volatility has been 8.68%, and QNT is consolidating with no clear breakout signal.
Sideways consolidation expected as breakout risk remains limited next week
For the next 7 days, QNT is expected to remain within a $67.60 to $73.30 corridor based on current weekly volatility. The probability of an upward breakout is low, with less than 20% odds, and indicators do not show bullish momentum. The most probable scenario is continued sideways consolidation between support at $67.60 and resistance at $73.30. Should QNT break below $67.60, a drop toward recent lows is possible, while a decisive push above $73.30 is required to reverse the current bearish structure, though this outcome is unlikely in the near term.
Earlier, analysts noted that Quant was experiencing persistent bearish momentum with limited prospects for immediate reversal. The current setup reinforces this cautious stance, highlighting ongoing consolidation within a defined range and emphasizing that a decisive move above resistance remains crucial for signaling any meaningful trend shift.


-
 Afghanistan
-
 Albania
-
 Algeria
-
 Angola
-
 Argentina
-
 Armenia
-
 Australia
-
 Austria
-
 Azerbaijan
-
 Bahamas
-
 Bahrain
-
 Bangladesh
-
 Belarus
-
 Belgium
-
 Bolivia
-
 Botswana
-
 Brazil
-
 Brunei
-
 Bulgaria
-
 Cambodia
-
 Cameroon
-
 Canada
-
 Chile
Chile
-
 China
China
-
 Colombia
-
 Congo
Congo
-
 Costa Rica
-
 Cote d'Ivoire
-
 Croatia
-
 Cuba
Cuba
-
 Cyprus
-
 Czechia
-
 DR Congo
-
 Denmark
-
 Dominican Republic
-
 Ecuador
-
 Egypt
Egypt
-
 El Salvador
-
 Estonia
-
 Eswatini
-
 Ethiopia
-
 Finland
-
 France
-
 Georgia
-
 Germany
-
 Ghana
Ghana
-
 Greece
-
 Haiti
Haiti
-
 Hong Kong
-
 Hungary
-
 India
India
-
 Indonesia
-
 Iran, Islamic republic
-
 Iraq
Iraq
-
 Ireland
-
 Israel
-
 Italy
Italy
-
 Jamaica
-
 Japan
Japan
-
 Jordan
-
 Kazakhstan
-
 Kenya
Kenya
-
 Korea
Korea
-
 Kuwait
-
 Kyrgyzstan
-
 Laos
Laos
-
 Latvia
-
 Lebanon
-
 Lesotho
-
 Libya
Libya
-
 Lithuania
-
 Luxembourg
-
 Madagascar
-
 Malaysia
-
 Malta
Malta
-
 Mauritius
-
 Mexico
-
 Moldova
-
 Mongolia
-
 Montenegro
-
 Morocco
-
 Mozambique
-
 Myanmar
-
 Namibia
-
 Nepal
Nepal
-
 Netherlands
-
 New Zealand
-
 Nigeria
-
 North Macedonia
-
 Norway
-
 Oman
Oman
-
 Pakistan
-
 Palestine
-
 Panama
-
 Papua New Guinea
-
 Paraguay
-
 Peru
Peru
-
 Philippines
-
 Poland
-
 Portugal
-
 Puerto Rico
-
 Qatar
Qatar
-
 Reunion
-
 Romania
-
 Rwanda
-
 Saudi Arabia
-
 Serbia
-
 Singapore
-
 Slovakia
-
 Slovenia
-
 Somalia
-
 South Africa
-
 Spain
Spain
-
 Sri Lanka
-
 Sweden
-
 Switzerland
-
 Syria
Syria
-
 Taiwan
-
 Tajikistan
-
 Tanzania
-
 Thailand
-
 Trinidad and Tobago
-
 Tunisia
-
 Turkey
-
 UAE
UAE
-
 Uganda
-
 Ukraine
-
 United Kingdom
-
United States
-
 Uruguay
-
 Uzbekistan
-
 Venezuela
-
 Vietnam
-
 Yemen
Yemen
-
 Zambia
-
 Zimbabwe
- Forex
- Crypto
