
Quant declines as RSI and CCI point to oversold conditions: weekly report

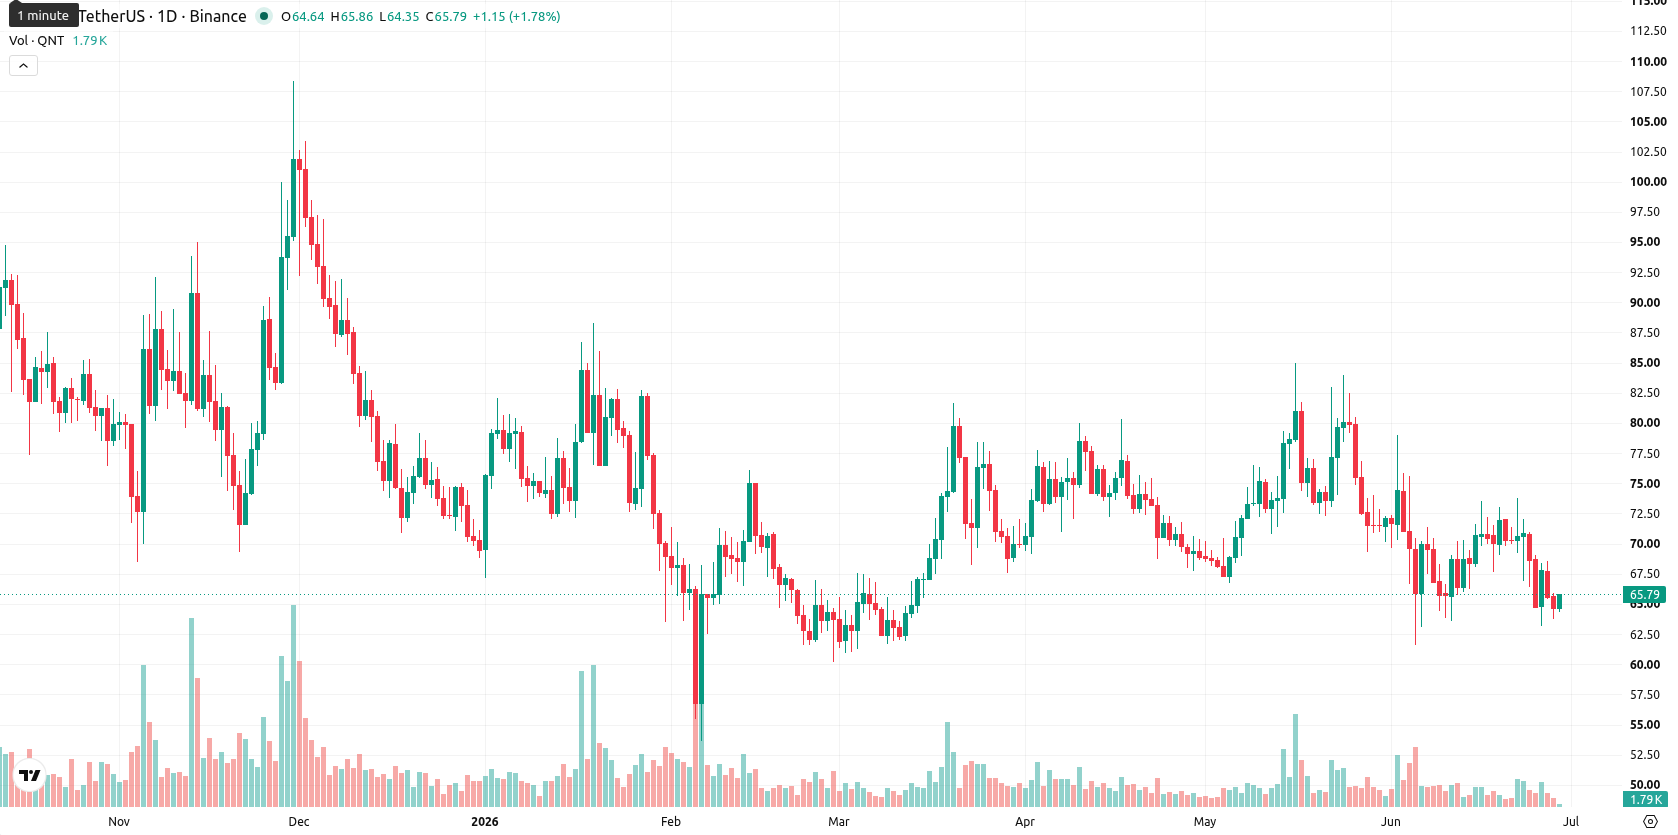
Quant (QNT) is currently trading at $65.80, marking a decline of $4.68 or 6.61% over the past week. The price remains below its key weekly moving averages, with QNT sitting under the MA-20 at $70.184, MA-50 at $82.762600, and MA-200 at $98.370250, signaling sustained downward pressure and a firm bearish trend.
Highlights
- Quant remains under sustained bearish pressure, trading below key moving averages, with sellers controlling both medium- and long-term trends.
- Momentum and oscillator signals confirm oversold conditions, and no key technical indicators suggest imminent bullish reversal.
- Expected trading range for the next week is $59.80 to $72.00, with volatility elevated and potential for further downside if $59.80 breaks.
No bullish signals as weekly oscillators confirm persistent selling
Weekly technical indicators reinforce the prevailing negative sentiment. The MACD on the weekly timeframe continues to issue a Sell signal, and the ADX at 13.38 suggests a weak trend. RSI, Stochastic RSI, and CCI all signal oversold conditions or persistent selling pressure. With the price lodged in the lower part of the weekly range and volatility at 13.92%, all major oscillators confirm that there is no sign of bullish divergence and sellers remain firmly in control.
Downside risk dominates as technicals limit next week’s recovery
For the next 7 days, QNT is expected to trade within a volatile range between $59.80 and $72.00. Weekly data shows a much higher probability of further downside than recovery, with less than a 20% chance of an upward move given that RSI, ADX, MACD, and CCI are not in Buy territory. The baseline scenario is for price consolidation in the $59.80–$72.00 zone. If QNT breaks above $72.00, a short-term bounce toward the MA-20 resistance may be possible, but if support at $59.80 is lost, further declines are likely.
Earlier, analysts noted that Quant was experiencing persistent bearish momentum and continued technical weakness. The latest data strengthens this view, with heightened volatility and reinforced downside risks making sustained recovery unlikely unless sellers lose control at key support levels.


-
 Afghanistan
-
 Albania
-
 Algeria
-
 Angola
-
 Argentina
-
 Armenia
-
 Australia
-
 Austria
-
 Azerbaijan
-
 Bahamas
-
 Bahrain
-
 Bangladesh
-
 Belarus
-
 Belgium
-
 Bolivia
-
 Botswana
-
 Brazil
-
 Brunei
-
 Bulgaria
-
 Cambodia
-
 Cameroon
-
 Canada
-
 Chile
Chile
-
 China
China
-
 Colombia
-
 Congo
Congo
-
 Costa Rica
-
 Cote d'Ivoire
-
 Croatia
-
 Cuba
Cuba
-
 Cyprus
-
 Czechia
-
 DR Congo
-
 Denmark
-
 Dominican Republic
-
 Ecuador
-
 Egypt
Egypt
-
 El Salvador
-
 Estonia
-
 Eswatini
-
 Ethiopia
-
 Finland
-
 France
-
 Georgia
-
 Germany
-
 Ghana
Ghana
-
 Greece
-
 Haiti
Haiti
-
 Hong Kong
-
 Hungary
-
 India
India
-
 Indonesia
-
 Iran, Islamic republic
-
 Iraq
Iraq
-
 Ireland
-
 Israel
-
 Italy
Italy
-
 Jamaica
-
 Japan
Japan
-
 Jordan
-
 Kazakhstan
-
 Kenya
Kenya
-
 Korea
Korea
-
 Kuwait
-
 Kyrgyzstan
-
 Laos
Laos
-
 Latvia
-
 Lebanon
-
 Lesotho
-
 Libya
Libya
-
 Lithuania
-
 Luxembourg
-
 Madagascar
-
 Malaysia
-
 Malta
Malta
-
 Mauritius
-
 Mexico
-
 Moldova
-
 Mongolia
-
 Montenegro
-
 Morocco
-
 Mozambique
-
 Myanmar
-
 Namibia
-
 Nepal
Nepal
-
 Netherlands
-
 New Zealand
-
 Nigeria
-
 North Macedonia
-
 Norway
-
 Oman
Oman
-
 Pakistan
-
 Palestine
-
 Panama
-
 Papua New Guinea
-
 Paraguay
-
 Peru
Peru
-
 Philippines
-
 Poland
-
 Portugal
-
 Puerto Rico
-
 Qatar
Qatar
-
 Reunion
-
 Romania
-
 Rwanda
-
 Saudi Arabia
-
 Serbia
-
 Singapore
-
 Slovakia
-
 Slovenia
-
 Somalia
-
 South Africa
-
 Spain
Spain
-
 Sri Lanka
-
 Sweden
-
 Switzerland
-
 Syria
Syria
-
 Taiwan
-
 Tajikistan
-
 Tanzania
-
 Thailand
-
 Trinidad and Tobago
-
 Tunisia
-
 Turkey
-
 UAE
UAE
-
 Uganda
-
 Ukraine
-
 United Kingdom
-
United States
-
 Uruguay
-
 Uzbekistan
-
 Venezuela
-
 Vietnam
-
 Yemen
Yemen
-
 Zambia
-
 Zimbabwe
- Forex
- Crypto
