
Persistent demand pushes Celestia higher in a sustained technical rally

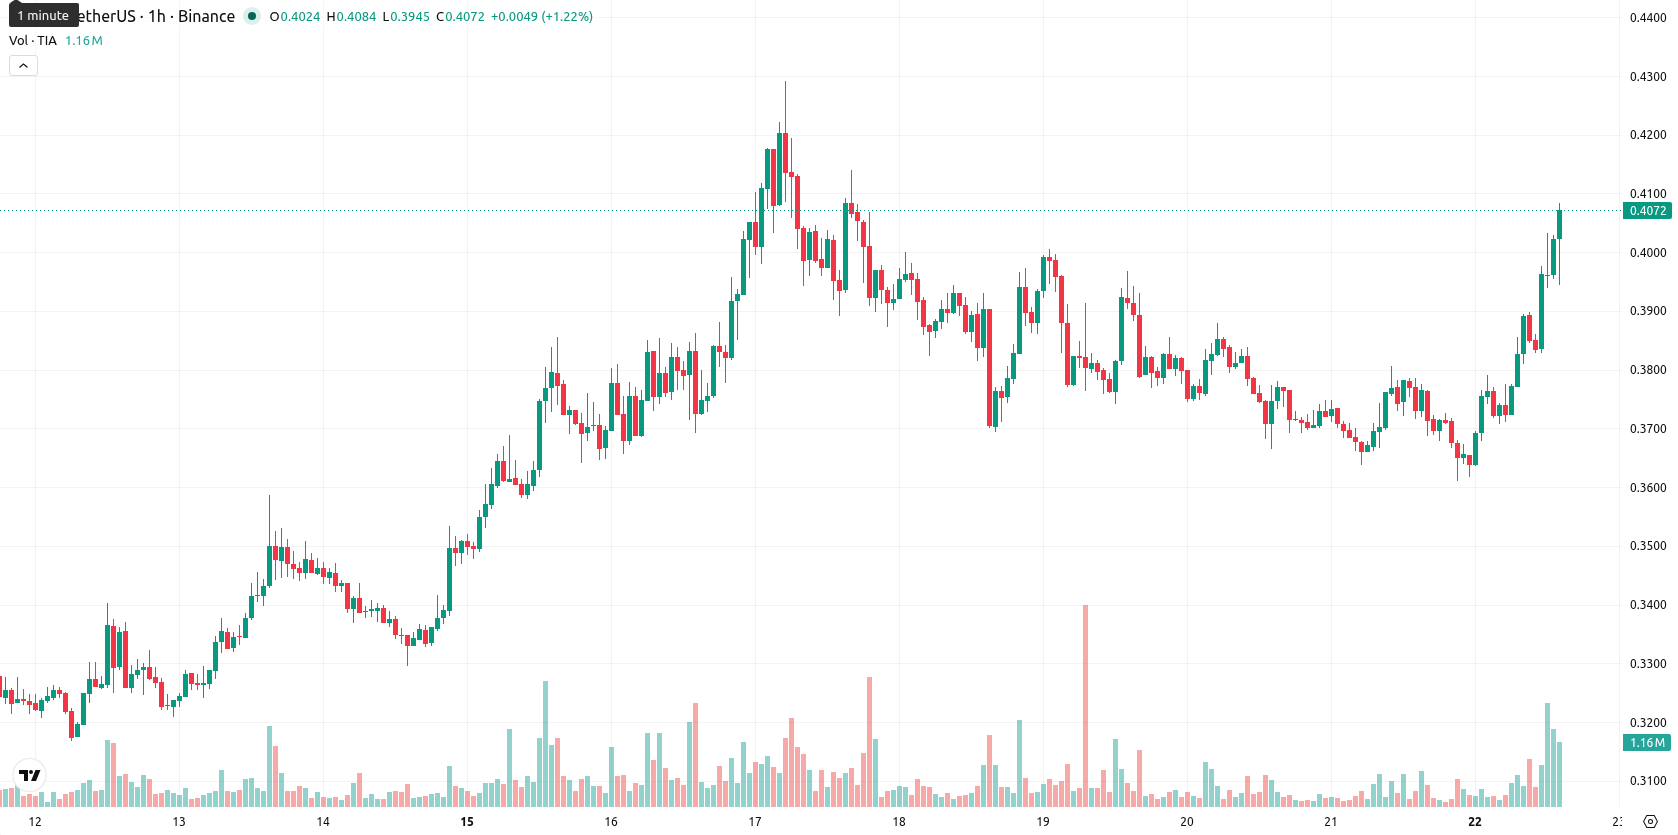
Celestia (TIA) is trading at $0.4058, up 8.88% on the day, and remains above its key moving averages. The asset is near session highs, reflecting strong positive momentum with notable intraday volatility.
Highlights
- TIA/USD trades firmly above key moving averages on multiple timeframes, reinforcing a bullish short- and long-term trend structure.
- Upward momentum remains dominant, but overbought technical indicators signal growing risk of short-term exhaustion or consolidation.
- TIA/USD is expected to consolidate within the $0.3906 to $0.421 range over the next several sessions, with further upside likely if resistance breaks.
Buyer dominance confirmed as technical signals warn of exhaustion
On the technical front, TIA/USD is holding above the MA-20 ($0.3777) and MA-50 ($0.3745) on the H1 timeframe, as well as the MA-200 ($0.4) on the daily chart. Immediate support is defined by the Ichimoku Kijun at $0.3821. Momentum signals show the MACD in buy mode, ADX neutral, and AO bullish. The RSI sits at 70.75, suggesting strong buying activity, but both Stoch RSI and CCI are overbought, indicating a risk of short-term exhaustion. Bull/Bear Power (BBP) and intraday action confirm buyer dominance, with price momentum aligned to the day’s bullish move and a minor negative gap of $0.0087.
Bullish continuation likely as consolidation narrows near resistance
Over the next two to three sessions, TIA/USD is likely to consolidate within a typical volatility band ranging from $0.3906 to $0.421. The most probable scenario is a continuation of consolidation between these levels, with a high likelihood of upward movement. A sustained breakout above resistance would trigger a more pronounced advance, while any drop below immediate support could bring a deeper pullback.
Earlier, analysts noted that Celestia was under sustained bearish pressure and was struggling to overcome a dominant negative trend. The latest surge above key averages and overbought signals suggests a potential short-term shift in momentum, so traders should watch for sustained movement above resistance to confirm a deeper bullish reversal.


Latest Celestia News


-
 Afghanistan
-
 Albania
-
 Algeria
-
 Angola
-
 Argentina
-
 Armenia
-
 Australia
-
 Austria
-
 Azerbaijan
-
 Bahamas
-
 Bahrain
-
 Bangladesh
-
 Belarus
-
 Belgium
-
 Bolivia
-
 Botswana
-
 Brazil
-
 Brunei
-
 Bulgaria
-
 Cambodia
-
 Cameroon
-
 Canada
-
 Chile
Chile
-
 China
China
-
 Colombia
-
 Congo
Congo
-
 Costa Rica
-
 Cote d'Ivoire
-
 Croatia
-
 Cuba
Cuba
-
 Cyprus
-
 Czechia
-
 DR Congo
-
 Denmark
-
 Dominican Republic
-
 Ecuador
-
 Egypt
Egypt
-
 El Salvador
-
 Estonia
-
 Eswatini
-
 Ethiopia
-
 Finland
-
 France
-
 Georgia
-
 Germany
-
 Ghana
Ghana
-
 Greece
-
 Haiti
Haiti
-
 Hong Kong
-
 Hungary
-
 India
India
-
 Indonesia
-
 Iran, Islamic republic
-
 Iraq
Iraq
-
 Ireland
-
 Israel
-
 Italy
Italy
-
 Jamaica
-
 Japan
Japan
-
 Jordan
-
 Kazakhstan
-
 Kenya
Kenya
-
 Korea
Korea
-
 Kuwait
-
 Kyrgyzstan
-
 Laos
Laos
-
 Latvia
-
 Lebanon
-
 Lesotho
-
 Libya
Libya
-
 Lithuania
-
 Luxembourg
-
 Madagascar
-
 Malaysia
-
 Malta
Malta
-
 Mauritius
-
 Mexico
-
 Moldova
-
 Mongolia
-
 Montenegro
-
 Morocco
-
 Mozambique
-
 Myanmar
-
 Namibia
-
 Nepal
Nepal
-
 Netherlands
-
 New Zealand
-
 Nigeria
-
 North Macedonia
-
 Norway
-
 Oman
Oman
-
 Pakistan
-
 Palestine
-
 Panama
-
 Papua New Guinea
-
 Paraguay
-
 Peru
Peru
-
 Philippines
-
 Poland
-
 Portugal
-
 Puerto Rico
-
 Qatar
Qatar
-
 Reunion
-
 Romania
-
 Rwanda
-
 Saudi Arabia
-
 Serbia
-
 Singapore
-
 Slovakia
-
 Slovenia
-
 Somalia
-
 South Africa
-
 Spain
Spain
-
 Sri Lanka
-
 Sweden
-
 Switzerland
-
 Syria
Syria
-
 Taiwan
-
 Tajikistan
-
 Tanzania
-
 Thailand
-
 Trinidad and Tobago
-
 Tunisia
-
 Turkey
-
 UAE
UAE
-
 Uganda
-
 Ukraine
-
 United Kingdom
-
United States
-
 Uruguay
-
 Uzbekistan
-
 Venezuela
-
 Vietnam
-
 Yemen
Yemen
-
 Zambia
-
 Zimbabwe
- Forex
- Crypto
