

Shiba Inu (SHIB) is trading at $0.0000042 after falling 7.02% today and remains below its key moving averages. The asset continues to show weakness against both short- and long-term trend levels.
Highlights
- A leading Shiba Inu whale offloaded 600 billion SHIB amid a broad 3.8 trillion SHIB sell-off, intensifying price pressure and boosting circulating supply.
- Shiba Inu's deflationary momentum weakened as the daily token burn rate fell 74%, while over 28 billion SHIB exited exchanges, slightly reducing short-term sell risk.
- Technical indicators confirm a strongly bearish trend, with SHIB trading below key averages and an expected range of $0.00000409–$0.00000431 amid high volatility.
Whale selling intensifies amid retail push and fading deflationary trend
A major Shiba Inu whale, described as the 'top SHIB donor', moved 600 billion tokens worth $2.83 million as part of a wider sell-off totaling 3.8 trillion SHIB, which increased circulating supply and amplified downward price pressure. Rakuten Wallet has launched dedicated educational content and marketing campaigns, including the 'Understanding SHIB' video series led by senior analyst Matsuda, according to Pluang, aiming to expand retail engagement, though this initiative has so far been accompanied by persistent selling. Meanwhile, a 74% drop in Shiba Inu's burn rate and only $13 burned in the last day has weakened the asset’s deflationary momentum, while more than 28 billion SHIB have exited exchanges in the past 24 hours, providing a modest offset by lowering immediate selling risk.
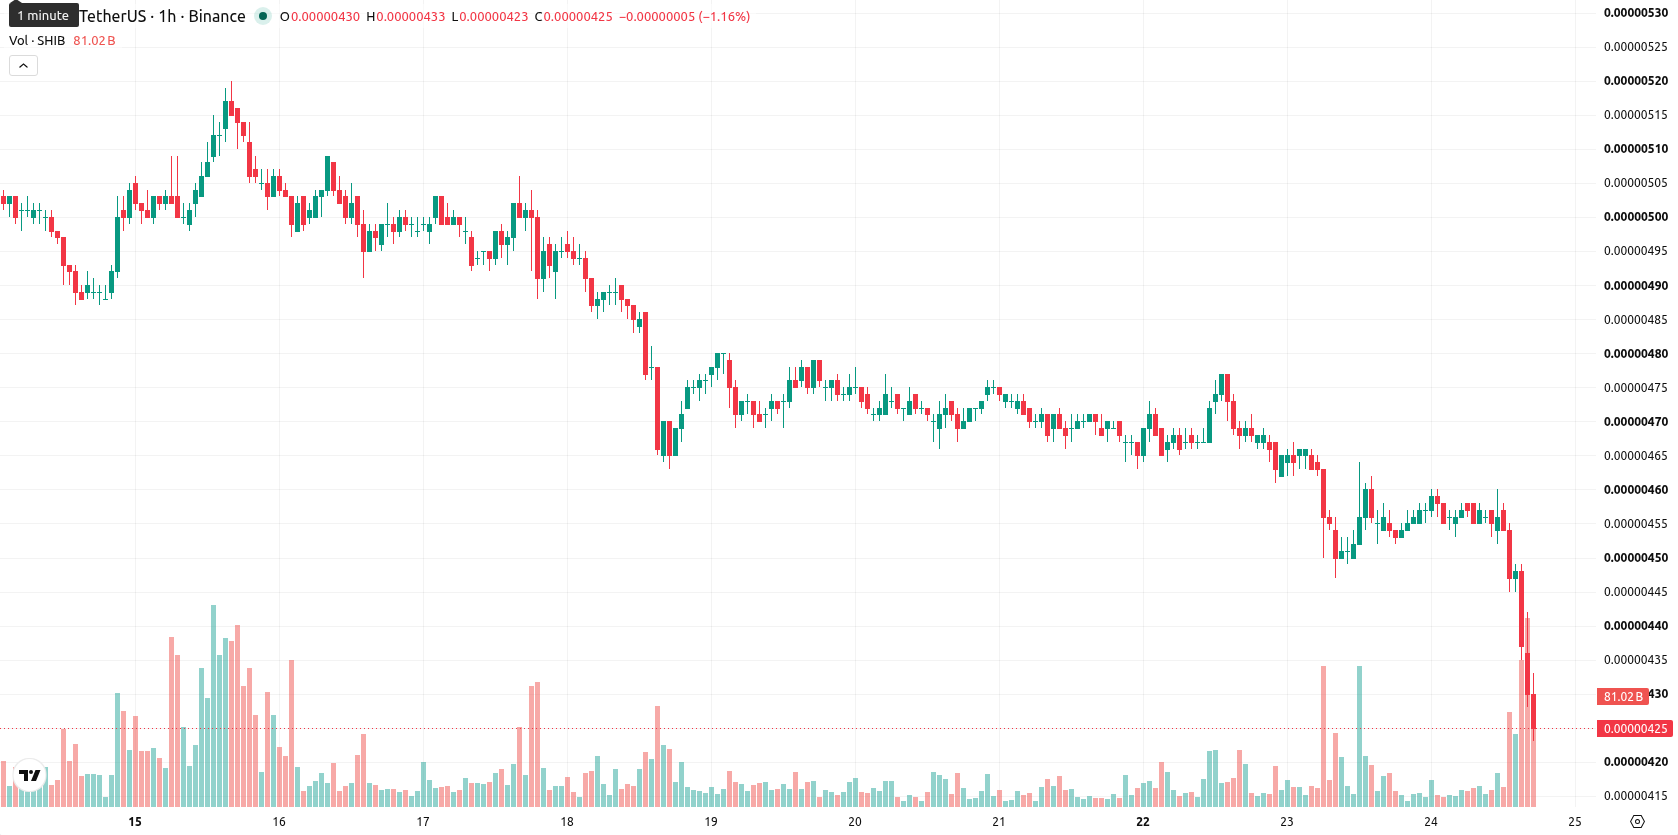
Oversold conditions persist as sellers dominate against layered resistance
On the h1 timeframe, SHIB/USD is positioned below the MA-20 at $0.00000453 and the MA-50 at $0.00000457. The long-term MA-200 sits above at $0.00000643, marking a distant resistance level. The Ichimoku Kijun line at $0.00000447 forms immediate overhead resistance. On the downside, support is seen at $0.00000409. The Moving Average Convergence Divergence (MACD) signals a sell, while the Average Directional Index (ADX) reads neutral, suggesting weak overall trend strength. Both the Relative Strength Index (RSI) at 26.47 and Commodity Channel Index (CCI) indicate oversold market conditions, which is echoed by an oversold reading on the Stochastic RSI. Bull/Bear Power points to seller dominance during the trading session, and the Awesome Oscillator confirms alignment with downside momentum.
Rangebound outlook holds while downside risks front-load near support
Over the next two to three sessions, SHIB is expected to trade in a narrow range between $0.00000409 and $0.00000431, reflecting typical volatility around current levels. A bullish reversal would require a firm breakout above immediate resistance at $0.00000447. Conversely, if SHIB breaches $0.00000409, the risk of further downside accelerates and a move lower becomes the dominant scenario.
Earlier, analysts noted that sellers continued to dominate Shiba Inu’s trend reinforcing an overall bearish momentum amid persistent negative sentiment. The ongoing whale-driven sell-off and declining burn rate further strengthen this negative outlook, making a breach below $0.00000409 the primary risk to monitor in the near term.


-
 Afghanistan
-
 Albania
-
 Algeria
-
 Angola
-
 Argentina
-
 Armenia
-
 Australia
-
 Austria
-
 Azerbaijan
-
 Bahamas
-
 Bahrain
-
 Bangladesh
-
 Belarus
-
 Belgium
-
 Bolivia
-
 Botswana
-
 Brazil
-
 Brunei
-
 Bulgaria
-
 Cambodia
-
 Cameroon
-
 Canada
-
 Chile
Chile
-
 China
China
-
 Colombia
-
 Congo
Congo
-
 Costa Rica
-
 Cote d'Ivoire
-
 Croatia
-
 Cuba
Cuba
-
 Cyprus
-
 Czechia
-
 DR Congo
-
 Denmark
-
 Dominican Republic
-
 Ecuador
-
 Egypt
Egypt
-
 El Salvador
-
 Estonia
-
 Eswatini
-
 Ethiopia
-
 Finland
-
 France
-
 Georgia
-
 Germany
-
 Ghana
Ghana
-
 Greece
-
 Haiti
Haiti
-
 Hong Kong
-
 Hungary
-
 India
India
-
 Indonesia
-
 Iran, Islamic republic
-
 Iraq
Iraq
-
 Ireland
-
 Israel
-
 Italy
Italy
-
 Jamaica
-
 Japan
Japan
-
 Jordan
-
 Kazakhstan
-
 Kenya
Kenya
-
 Korea
Korea
-
 Kuwait
-
 Kyrgyzstan
-
 Laos
Laos
-
 Latvia
-
 Lebanon
-
 Lesotho
-
 Libya
Libya
-
 Lithuania
-
 Luxembourg
-
 Madagascar
-
 Malaysia
-
 Malta
Malta
-
 Mauritius
-
 Mexico
-
 Moldova
-
 Mongolia
-
 Montenegro
-
 Morocco
-
 Mozambique
-
 Myanmar
-
 Namibia
-
 Nepal
Nepal
-
 Netherlands
-
 New Zealand
-
 Nigeria
-
 North Macedonia
-
 Norway
-
 Oman
Oman
-
 Pakistan
-
 Palestine
-
 Panama
-
 Papua New Guinea
-
 Paraguay
-
 Peru
Peru
-
 Philippines
-
 Poland
-
 Portugal
-
 Puerto Rico
-
 Qatar
Qatar
-
 Reunion
-
 Romania
-
 Rwanda
-
 Saudi Arabia
-
 Serbia
-
 Singapore
-
 Slovakia
-
 Slovenia
-
 Somalia
-
 South Africa
-
 Spain
Spain
-
 Sri Lanka
-
 Sweden
-
 Switzerland
-
 Syria
Syria
-
 Taiwan
-
 Tajikistan
-
 Tanzania
-
 Thailand
-
 Trinidad and Tobago
-
 Tunisia
-
 Turkey
-
 UAE
UAE
-
 Uganda
-
 Ukraine
-
 United Kingdom
-
United States
-
 Uruguay
-
 Uzbekistan
-
 Venezuela
-
 Vietnam
-
 Yemen
Yemen
-
 Zambia
-
 Zimbabwe
- Forex
- Crypto
