
Plasma price prediction: Will $0.1116 resistance cap XPL rally?

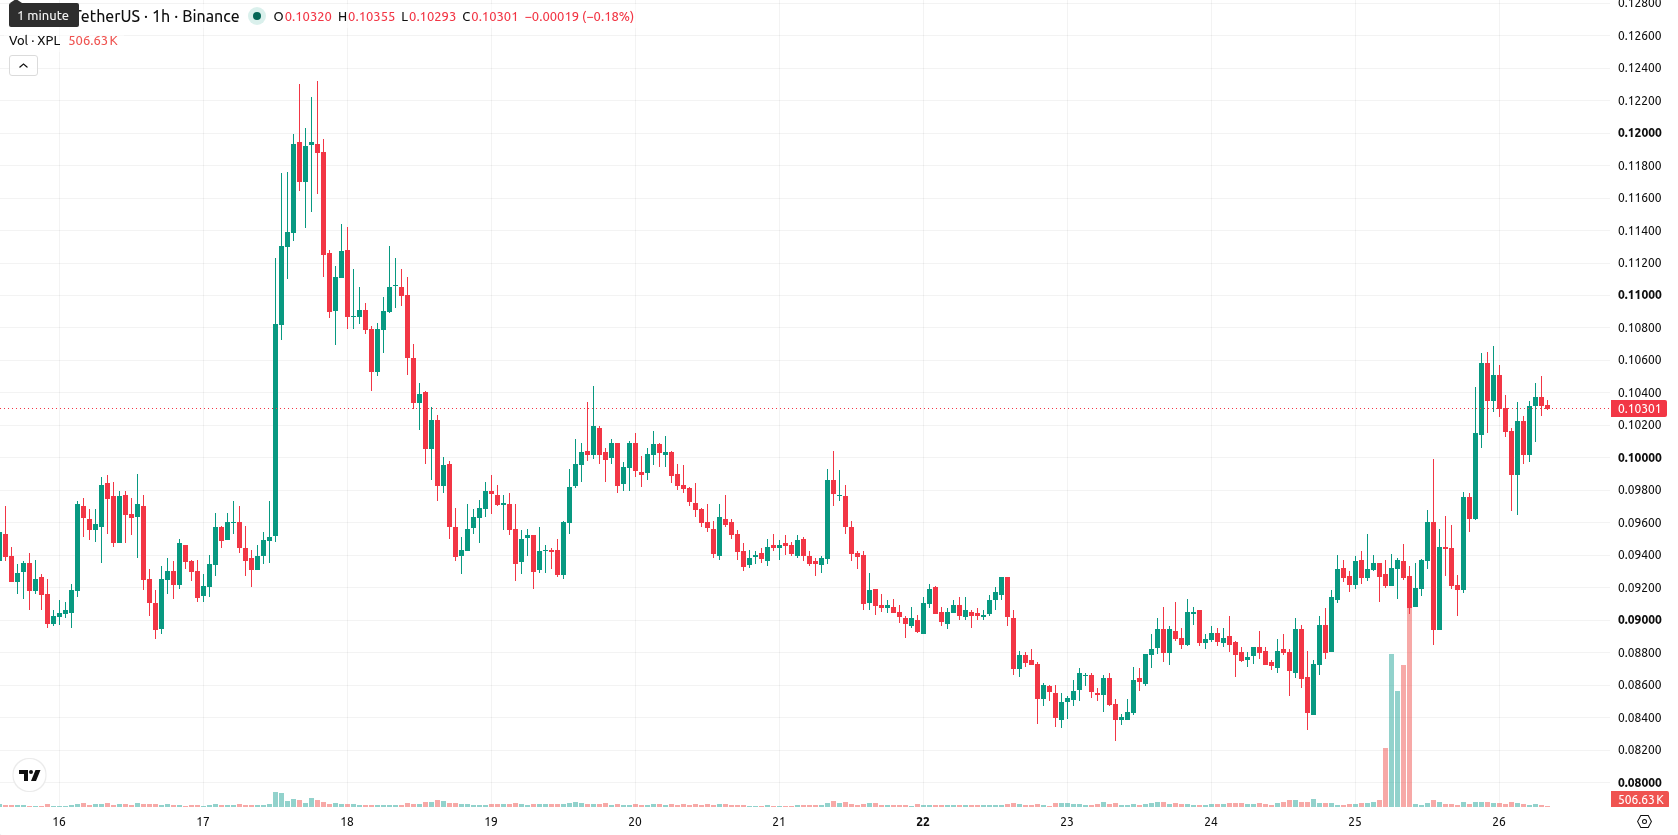
Plasma (XPL) is trading at $0.1033, up 10.49% for the day. The price sits above its key moving averages on shorter timeframes while remaining under longer-term levels.
Highlights
- XPL/USD exhibits a constructive short- and medium-term setup, trading above key moving averages but still below its long-term trend level.
- Momentum indicators generally favor buyers, though some divergence and neutral signals warrant caution as not all metrics confirm the current uptrend.
- Price is expected to consolidate between $0.0979 and $0.1087, with a strong probability of upside and immediate support at $0.0976.
Mixed momentum as resistance holds and support firms
On the h1 chart, XPL/USD is trading above the MA-20 at $0.0988 and MA-50 at $0.0936, but remains below the long-term MA-200 at $0.1116. Immediate support is defined by the daily Ichimoku Kijun at $0.0976, with the expected short-term price range likely bounded by $0.0979 and $0.1087. Technical indicators point to strong but not unanimous momentum: the Relative Strength Index (RSI) is at 60.37 and returns a Buy signal; the Moving Average Convergence Divergence (MACD) is also on Buy; the Commodity Channel Index (CCI) supports buyers; Bull/Bear Power indicates buyer dominance. However, the Average Directional Index (ADX), Stochastic RSI, and Awesome Oscillator are Neutral, signaling mixed trend strength and suggesting some divergence.
Breakout or breakdown risk as XPL/USD nears volatility bands
Looking ahead over the coming trading days, the baseline expectation is for XPL/USD to consolidate between $0.0979 and $0.1087, which aligns with typical volatility for this asset. A decisive break above the upper band could trigger further gains as bullish momentum accelerates. Conversely, a break below immediate support at $0.0976 would expose downside risk and may lead to renewed selling pressure.
Earlier, analysts noted that Plasma (XPL) was showing strong short- and medium-term bullish momentum despite persistent longer-term resistance. Recent price action and diverging technical signals reinforce the outlook for consolidation, with any sustained move above near-term resistance likely to set the tone for the next trend leg.


-
 Afghanistan
-
 Albania
-
 Algeria
-
 Angola
-
 Argentina
-
 Armenia
-
 Australia
-
 Austria
-
 Azerbaijan
-
 Bahamas
-
 Bahrain
-
 Bangladesh
-
 Belarus
-
 Belgium
-
 Bolivia
-
 Botswana
-
 Brazil
-
 Brunei
-
 Bulgaria
-
 Cambodia
-
 Cameroon
-
 Canada
-
 Chile
Chile
-
 China
China
-
 Colombia
-
 Congo
Congo
-
 Costa Rica
-
 Cote d'Ivoire
-
 Croatia
-
 Cuba
Cuba
-
 Cyprus
-
 Czechia
-
 DR Congo
-
 Denmark
-
 Dominican Republic
-
 Ecuador
-
 Egypt
Egypt
-
 El Salvador
-
 Estonia
-
 Eswatini
-
 Ethiopia
-
 Finland
-
 France
-
 Georgia
-
 Germany
-
 Ghana
Ghana
-
 Greece
-
 Haiti
Haiti
-
 Hong Kong
-
 Hungary
-
 India
India
-
 Indonesia
-
 Iran, Islamic republic
-
 Iraq
Iraq
-
 Ireland
-
 Israel
-
 Italy
Italy
-
 Jamaica
-
 Japan
Japan
-
 Jordan
-
 Kazakhstan
-
 Kenya
Kenya
-
 Korea
Korea
-
 Kuwait
-
 Kyrgyzstan
-
 Laos
Laos
-
 Latvia
-
 Lebanon
-
 Lesotho
-
 Libya
Libya
-
 Lithuania
-
 Luxembourg
-
 Madagascar
-
 Malaysia
-
 Malta
Malta
-
 Mauritius
-
 Mexico
-
 Moldova
-
 Mongolia
-
 Montenegro
-
 Morocco
-
 Mozambique
-
 Myanmar
-
 Namibia
-
 Nepal
Nepal
-
 Netherlands
-
 New Zealand
-
 Nigeria
-
 North Macedonia
-
 Norway
-
 Oman
Oman
-
 Pakistan
-
 Palestine
-
 Panama
-
 Papua New Guinea
-
 Paraguay
-
 Peru
Peru
-
 Philippines
-
 Poland
-
 Portugal
-
 Puerto Rico
-
 Qatar
Qatar
-
 Reunion
-
 Romania
-
 Rwanda
-
 Saudi Arabia
-
 Serbia
-
 Singapore
-
 Slovakia
-
 Slovenia
-
 Somalia
-
 South Africa
-
 Spain
Spain
-
 Sri Lanka
-
 Sweden
-
 Switzerland
-
 Syria
Syria
-
 Taiwan
-
 Tajikistan
-
 Tanzania
-
 Thailand
-
 Trinidad and Tobago
-
 Tunisia
-
 Turkey
-
 UAE
UAE
-
 Uganda
-
 Ukraine
-
 United Kingdom
-
United States
-
 Uruguay
-
 Uzbekistan
-
 Venezuela
-
 Vietnam
-
 Yemen
Yemen
-
 Zambia
-
 Zimbabwe
- Forex
- Crypto
