
Celestia gains as short-term momentum extends above key moving averages

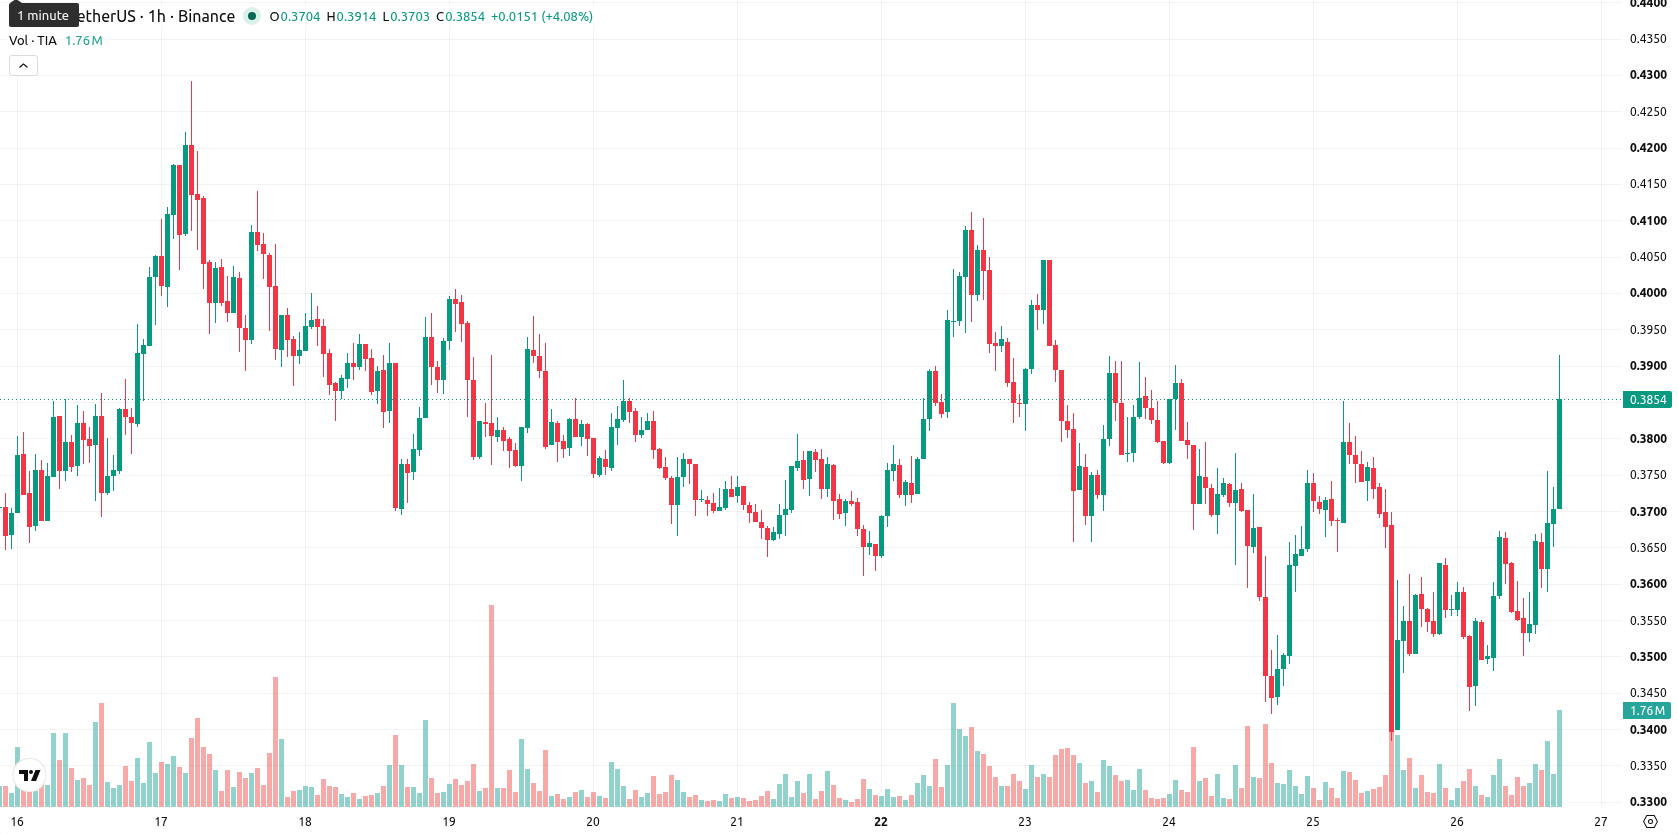
Celestia (TIA) is trading at $0.3891, up 8.9% on the day. The asset currently sits above its short- and medium-term moving averages, while remaining below the long-term benchmark.
Highlights
- TIA/USD shows short- and medium-term bullish momentum, but long-term trend remains under bearish pressure.
- Oscillators reveal overbought conditions and mixed signals, increasing the risk of heightened near-term volatility.
- Price is expected to trade between $0.3565 and $0.4054 next session, with a 71% probability of upward movement.
Bullish momentum diverges from overbought signals
On the technical side, TIA is positioned above the MA-20 and MA-50 on the hourly timeframe, but remains capped by the MA-200 on the daily chart. The Ichimoku Kijun at $0.3584 serves as immediate support. Among momentum indicators, the Moving Average Convergence Divergence (MACD) and Average Directional Index (ADX) are showing neutral signals, while the Relative Strength Index (RSI) signals a buy. The Stochastic RSI and Commodity Channel Index (CCI) indicate overbought conditions. Bull/Bear Power is positive, reflecting intraday buying dominance, and the Awesome Oscillator confirms a strong buy signal. These oscillator overbought readings contrast with ongoing bullish momentum, highlighting a divergence that could drive heightened short-term volatility.
Range-bound outlook as volatility risk persists
Looking into the next session, the expected volatility band is set between $0.3565 and $0.4054. Probabilities favor an upward move, estimated at 71%, while the chance of a downward move stands at 29%. The central scenario calls for TIA to remain range-bound within this corridor. However, a decisive break above resistance could see the asset extend toward the upper range, whereas a breakdown below support would amplify downside risk.
Earlier, analysts noted that Celestia was experiencing persistent selling pressure and a dominant bearish trend, with technical indicators signaling limited recovery prospects. The current shift toward intraday bullish momentum and oscillator overbought readings adds a new dimension to the outlook, and traders should now monitor for a potential volatility spike if TIA decisively breaks out of the $0.3565–$0.4054 range.


-
 Afghanistan
-
 Albania
-
 Algeria
-
 Angola
-
 Argentina
-
 Armenia
-
 Australia
-
 Austria
-
 Azerbaijan
-
 Bahamas
-
 Bahrain
-
 Bangladesh
-
 Belarus
-
 Belgium
-
 Bolivia
-
 Botswana
-
 Brazil
-
 Brunei
-
 Bulgaria
-
 Cambodia
-
 Cameroon
-
 Canada
-
 Chile
Chile
-
 China
China
-
 Colombia
-
 Congo
Congo
-
 Costa Rica
-
 Cote d'Ivoire
-
 Croatia
-
 Cuba
Cuba
-
 Cyprus
-
 Czechia
-
 DR Congo
-
 Denmark
-
 Dominican Republic
-
 Ecuador
-
 Egypt
Egypt
-
 El Salvador
-
 Estonia
-
 Eswatini
-
 Ethiopia
-
 Finland
-
 France
-
 Georgia
-
 Germany
-
 Ghana
Ghana
-
 Greece
-
 Haiti
Haiti
-
 Hong Kong
-
 Hungary
-
 India
India
-
 Indonesia
-
 Iran, Islamic republic
-
 Iraq
Iraq
-
 Ireland
-
 Israel
-
 Italy
Italy
-
 Jamaica
-
 Japan
Japan
-
 Jordan
-
 Kazakhstan
-
 Kenya
Kenya
-
 Korea
Korea
-
 Kuwait
-
 Kyrgyzstan
-
 Laos
Laos
-
 Latvia
-
 Lebanon
-
 Lesotho
-
 Libya
Libya
-
 Lithuania
-
 Luxembourg
-
 Madagascar
-
 Malaysia
-
 Malta
Malta
-
 Mauritius
-
 Mexico
-
 Moldova
-
 Mongolia
-
 Montenegro
-
 Morocco
-
 Mozambique
-
 Myanmar
-
 Namibia
-
 Nepal
Nepal
-
 Netherlands
-
 New Zealand
-
 Nigeria
-
 North Macedonia
-
 Norway
-
 Oman
Oman
-
 Pakistan
-
 Palestine
-
 Panama
-
 Papua New Guinea
-
 Paraguay
-
 Peru
Peru
-
 Philippines
-
 Poland
-
 Portugal
-
 Puerto Rico
-
 Qatar
Qatar
-
 Reunion
-
 Romania
-
 Rwanda
-
 Saudi Arabia
-
 Serbia
-
 Singapore
-
 Slovakia
-
 Slovenia
-
 Somalia
-
 South Africa
-
 Spain
Spain
-
 Sri Lanka
-
 Sweden
-
 Switzerland
-
 Syria
Syria
-
 Taiwan
-
 Tajikistan
-
 Tanzania
-
 Thailand
-
 Trinidad and Tobago
-
 Tunisia
-
 Turkey
-
 UAE
UAE
-
 Uganda
-
 Ukraine
-
 United Kingdom
-
United States
-
 Uruguay
-
 Uzbekistan
-
 Venezuela
-
 Vietnam
-
 Yemen
Yemen
-
 Zambia
-
 Zimbabwe
- Forex
- Crypto
