
Bitcoin price prediction: $61,936 resistance in focus as BTC trades flat

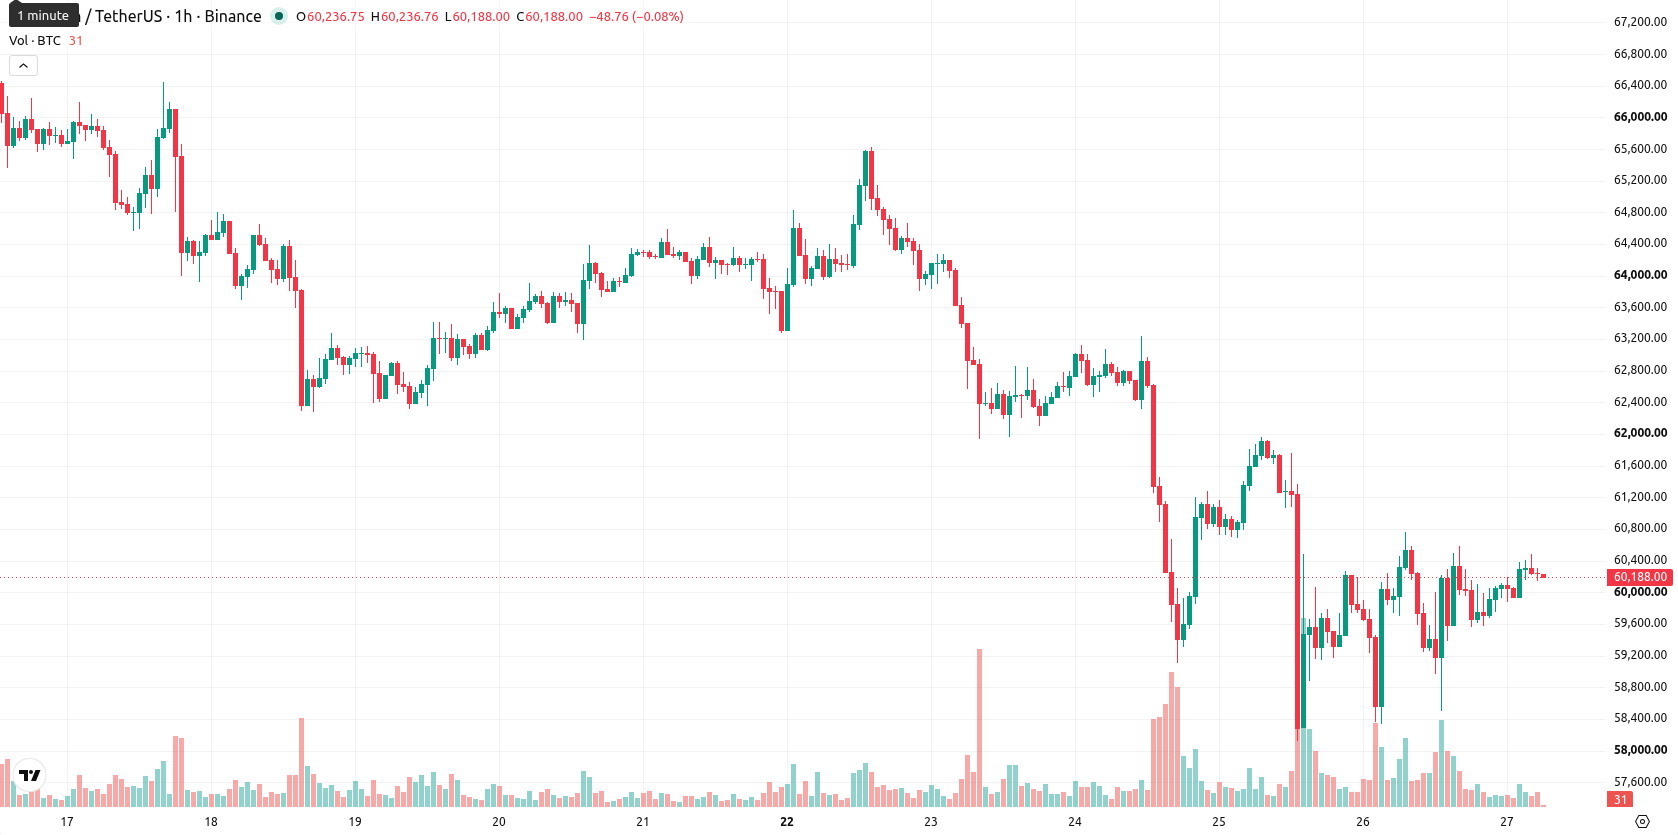
Bitcoin (BTC) is trading at $60,258, posting a modest gain for the session. The asset holds above its short- and medium-term moving averages, while remaining well below its longer-term trend levels.
Highlights
- Spot Bitcoin ETFs in the US saw the biggest single-day net outflow since May, with $691.7 million withdrawn on June 25.
- Elevated redemptions from BlackRock's IBIT, totaling $265.2 million on June 26, add to supply pressures and weaken near-term sentiment.
- Bitcoin trades above short-term averages but remains below longer-term resistance; market could consolidate between $58,579 and $61,936 over the next 2–3 days amid mixed momentum signals.
Institutional outflows drive liquidity concerns amid ETF redemptions
Spot Bitcoin ETFs in the United States experienced their largest daily net outflows since late May, with $691.7 million withdrawn on June 25, 2026, as reported by Finance Yahoo. This significant capital flight reflects falling institutional participation and can undermine liquidity in listed Bitcoin products. BlackRock's iShares Bitcoin Trust (IBIT) also saw elevated redemptions, with $265.2 million exiting the ETF on June 26, according to Cryptobriefing, adding to the supply overhang and shaping near-term sentiment.
Intraday bullish momentum offset by overbought signals and weak trend
BTC/USD is holding above both the 20- and 50-period moving averages on the hourly chart, but remains well under the 200-period daily moving average. The Ichimoku Kijun line at $59,548 serves as immediate support, which anchors the current price action. The Moving Average Convergence Divergence (MACD) provides a buy signal, while the Average Directional Index (ADX) is neutral, signaling limited trend strength. Relative Strength Index (RSI) registers at 55, indicating a modest buying bias, though Stochastic RSI, Commodity Channel Index (CCI), and Bull/Bear Power are overbought, highlighting strong buyer activity and the potential for short-term exhaustion. The Awesome Oscillator confirms bullish momentum, but mixed oscillator signals reveal some intraday divergence as volatility remains low.
Consolidation likely as upward bias hinges on key support
Over the next two to three trading days, BTC/USD is expected to trade within a typical volatility band between $58,579 and $61,936. Current technical and flow readings point to a 58% probability of an upward move, favoring further consolidation above key support levels. If resistance is overcome, upside continuation becomes probable, while a drop below $59,548 would put downside risks into focus.
Earlier, analysts noted that Bitcoin's trend remained cautiously negative, constrained by weak risk appetite and sustained selling pressure. The persistence of major ETF outflows and only modest technical improvement reinforce a consolidative outlook, making the ability to hold above immediate support at $59,548 a critical factor for near-term direction.


Latest Bitcoin News


-
 Afghanistan
-
 Albania
-
 Algeria
-
 Angola
-
 Argentina
-
 Armenia
-
 Australia
-
 Austria
-
 Azerbaijan
-
 Bahamas
-
 Bahrain
-
 Bangladesh
-
 Belarus
-
 Belgium
-
 Bolivia
-
 Botswana
-
 Brazil
-
 Brunei
-
 Bulgaria
-
 Cambodia
-
 Cameroon
-
 Canada
-
 Chile
Chile
-
 China
China
-
 Colombia
-
 Congo
Congo
-
 Costa Rica
-
 Cote d'Ivoire
-
 Croatia
-
 Cuba
Cuba
-
 Cyprus
-
 Czechia
-
 DR Congo
-
 Denmark
-
 Dominican Republic
-
 Ecuador
-
 Egypt
Egypt
-
 El Salvador
-
 Estonia
-
 Eswatini
-
 Ethiopia
-
 Finland
-
 France
-
 Georgia
-
 Germany
-
 Ghana
Ghana
-
 Greece
-
 Haiti
Haiti
-
 Hong Kong
-
 Hungary
-
 India
India
-
 Indonesia
-
 Iran, Islamic republic
-
 Iraq
Iraq
-
 Ireland
-
 Israel
-
 Italy
Italy
-
 Jamaica
-
 Japan
Japan
-
 Jordan
-
 Kazakhstan
-
 Kenya
Kenya
-
 Korea
Korea
-
 Kuwait
-
 Kyrgyzstan
-
 Laos
Laos
-
 Latvia
-
 Lebanon
-
 Lesotho
-
 Libya
Libya
-
 Lithuania
-
 Luxembourg
-
 Madagascar
-
 Malaysia
-
 Malta
Malta
-
 Mauritius
-
 Mexico
-
 Moldova
-
 Mongolia
-
 Montenegro
-
 Morocco
-
 Mozambique
-
 Myanmar
-
 Namibia
-
 Nepal
Nepal
-
 Netherlands
-
 New Zealand
-
 Nigeria
-
 North Macedonia
-
 Norway
-
 Oman
Oman
-
 Pakistan
-
 Palestine
-
 Panama
-
 Papua New Guinea
-
 Paraguay
-
 Peru
Peru
-
 Philippines
-
 Poland
-
 Portugal
-
 Puerto Rico
-
 Qatar
Qatar
-
 Reunion
-
 Romania
-
 Rwanda
-
 Saudi Arabia
-
 Serbia
-
 Singapore
-
 Slovakia
-
 Slovenia
-
 Somalia
-
 South Africa
-
 Spain
Spain
-
 Sri Lanka
-
 Sweden
-
 Switzerland
-
 Syria
Syria
-
 Taiwan
-
 Tajikistan
-
 Tanzania
-
 Thailand
-
 Trinidad and Tobago
-
 Tunisia
-
 Turkey
-
 UAE
UAE
-
 Uganda
-
 Ukraine
-
 United Kingdom
-
United States
-
 Uruguay
-
 Uzbekistan
-
 Venezuela
-
 Vietnam
-
 Yemen
Yemen
-
 Zambia
-
 Zimbabwe
- Forex
- Crypto
