
Ethereum price prediction: $1,698 resistance in view? ETH gains 1.50%

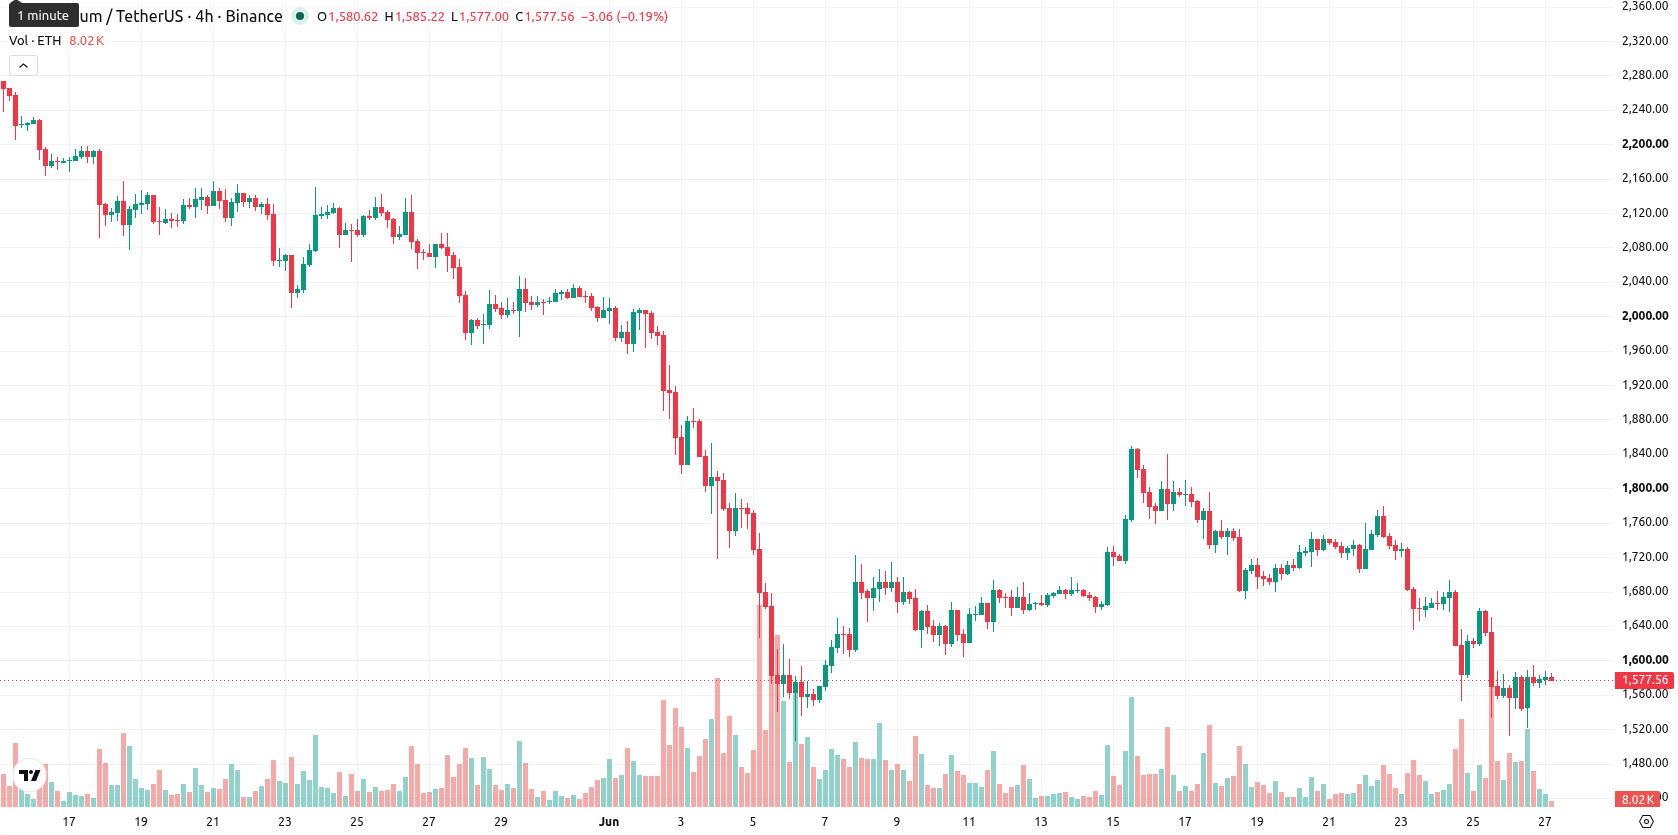
Ethereum (ETH) is trading at $1,579, up 1.5% in the last session. The price is currently positioned below its key moving averages on both the four-hour and daily timeframes.
Highlights
- Ethereum spot ETFs in the U.S. recorded $12.85 million in net outflows over seven days, signaling persistent selling pressure.
- Elevated U.S. inflation at 4.2% in May 2026 is increasing expectations for further rate hikes, curbing appetite for risk assets like ETH.
- ETH/USD trades below key moving averages with bearish momentum, projecting a likely range of $1,421–$1,698 and 74% down probability short term.
Dampened demand as sustained ETF outflows and inflation weigh on sentiment
Ethereum has faced measurable selling pressure from continued net outflows in U.S. spot Ethereum ETFs, with $12.848 million withdrawn over the past seven days, according to SoSoValue data cited by WEEX Crypto News. This sustained withdrawal signals retreating institutional and retail participation in regulated ETH products, which mechanically dampens demand and weighs on overall sentiment. Additional downward momentum stems from elevated U.S. inflation, which reached 4.2% in May 2026 as reported by the Commerce Department and highlighted by Dailycoin, heightening expectations for further monetary tightening and reducing appetite for risk assets.
Bearish momentum dominates as ETH stays below technical barriers
On the technical front, ETH/USD continues to trade below the 20-period ($1,605) and 50-period ($1,672) moving averages on the four-hour chart, as well as below the daily 200-period moving average ($2,328). The Ichimoku Kijun sits at $1,626 and acts as immediate resistance. Indicator readings show weak momentum: Moving Average Convergence Divergence (MACD) remains at Strong Sell, Average Directional Index (ADX) signals Sell, the Relative Strength Index (RSI) is at 41.58 (Sell), Stochastic RSI and Commodity Channel Index (CCI) suggest Sell and Neutral respectively, while Bull/Bear Power points to Oversold conditions. The Awesome Oscillator is Neutral and does not reinforce current pressure. These readings highlight dominance by sellers, though volatility is low and price remains mid-range.
Range-bound outlook as downside risk outweighs rebound odds
Looking ahead, ETH/USD is expected to trade in a range between $1,421 and $1,698 in the near term. Downside probability stands at 74%, while the probability of a sustained upward move is only 26%. The baseline scenario favors relatively stable action within the present volatility band. A move above immediate resistance could open room for further gains, while a breakdown below the support level would increase downside risk.
Earlier, analysts noted that the broader crypto market remains under pressure due to persistent fund outflows and concerns over U.S. inflation and monetary policy. Renewed selling in Ethereum spot ETFs, coupled with subdued momentum indicators, emphasizes a cautious stance, making it crucial for traders to monitor any decisive move outside the $1,421 to $1,698 range for signals of trend continuation or reversal.


Latest Ethereum News


-
 Afghanistan
-
 Albania
-
 Algeria
-
 Angola
-
 Argentina
-
 Armenia
-
 Australia
-
 Austria
-
 Azerbaijan
-
 Bahamas
-
 Bahrain
-
 Bangladesh
-
 Belarus
-
 Belgium
-
 Bolivia
-
 Botswana
-
 Brazil
-
 Brunei
-
 Bulgaria
-
 Cambodia
-
 Cameroon
-
 Canada
-
 Chile
Chile
-
 China
China
-
 Colombia
-
 Congo
Congo
-
 Costa Rica
-
 Cote d'Ivoire
-
 Croatia
-
 Cuba
Cuba
-
 Cyprus
-
 Czechia
-
 DR Congo
-
 Denmark
-
 Dominican Republic
-
 Ecuador
-
 Egypt
Egypt
-
 El Salvador
-
 Estonia
-
 Eswatini
-
 Ethiopia
-
 Finland
-
 France
-
 Georgia
-
 Germany
-
 Ghana
Ghana
-
 Greece
-
 Haiti
Haiti
-
 Hong Kong
-
 Hungary
-
 India
India
-
 Indonesia
-
 Iran, Islamic republic
-
 Iraq
Iraq
-
 Ireland
-
 Israel
-
 Italy
Italy
-
 Jamaica
-
 Japan
Japan
-
 Jordan
-
 Kazakhstan
-
 Kenya
Kenya
-
 Korea
Korea
-
 Kuwait
-
 Kyrgyzstan
-
 Laos
Laos
-
 Latvia
-
 Lebanon
-
 Lesotho
-
 Libya
Libya
-
 Lithuania
-
 Luxembourg
-
 Madagascar
-
 Malaysia
-
 Malta
Malta
-
 Mauritius
-
 Mexico
-
 Moldova
-
 Mongolia
-
 Montenegro
-
 Morocco
-
 Mozambique
-
 Myanmar
-
 Namibia
-
 Nepal
Nepal
-
 Netherlands
-
 New Zealand
-
 Nigeria
-
 North Macedonia
-
 Norway
-
 Oman
Oman
-
 Pakistan
-
 Palestine
-
 Panama
-
 Papua New Guinea
-
 Paraguay
-
 Peru
Peru
-
 Philippines
-
 Poland
-
 Portugal
-
 Puerto Rico
-
 Qatar
Qatar
-
 Reunion
-
 Romania
-
 Rwanda
-
 Saudi Arabia
-
 Serbia
-
 Singapore
-
 Slovakia
-
 Slovenia
-
 Somalia
-
 South Africa
-
 Spain
Spain
-
 Sri Lanka
-
 Sweden
-
 Switzerland
-
 Syria
Syria
-
 Taiwan
-
 Tajikistan
-
 Tanzania
-
 Thailand
-
 Trinidad and Tobago
-
 Tunisia
-
 Turkey
-
 UAE
UAE
-
 Uganda
-
 Ukraine
-
 United Kingdom
-
United States
-
 Uruguay
-
 Uzbekistan
-
 Venezuela
-
 Vietnam
-
 Yemen
Yemen
-
 Zambia
-
 Zimbabwe
- Forex
- Crypto
