
Ethereum price prediction: Will $1,638 resistance hold as ETH rises 1.79%?

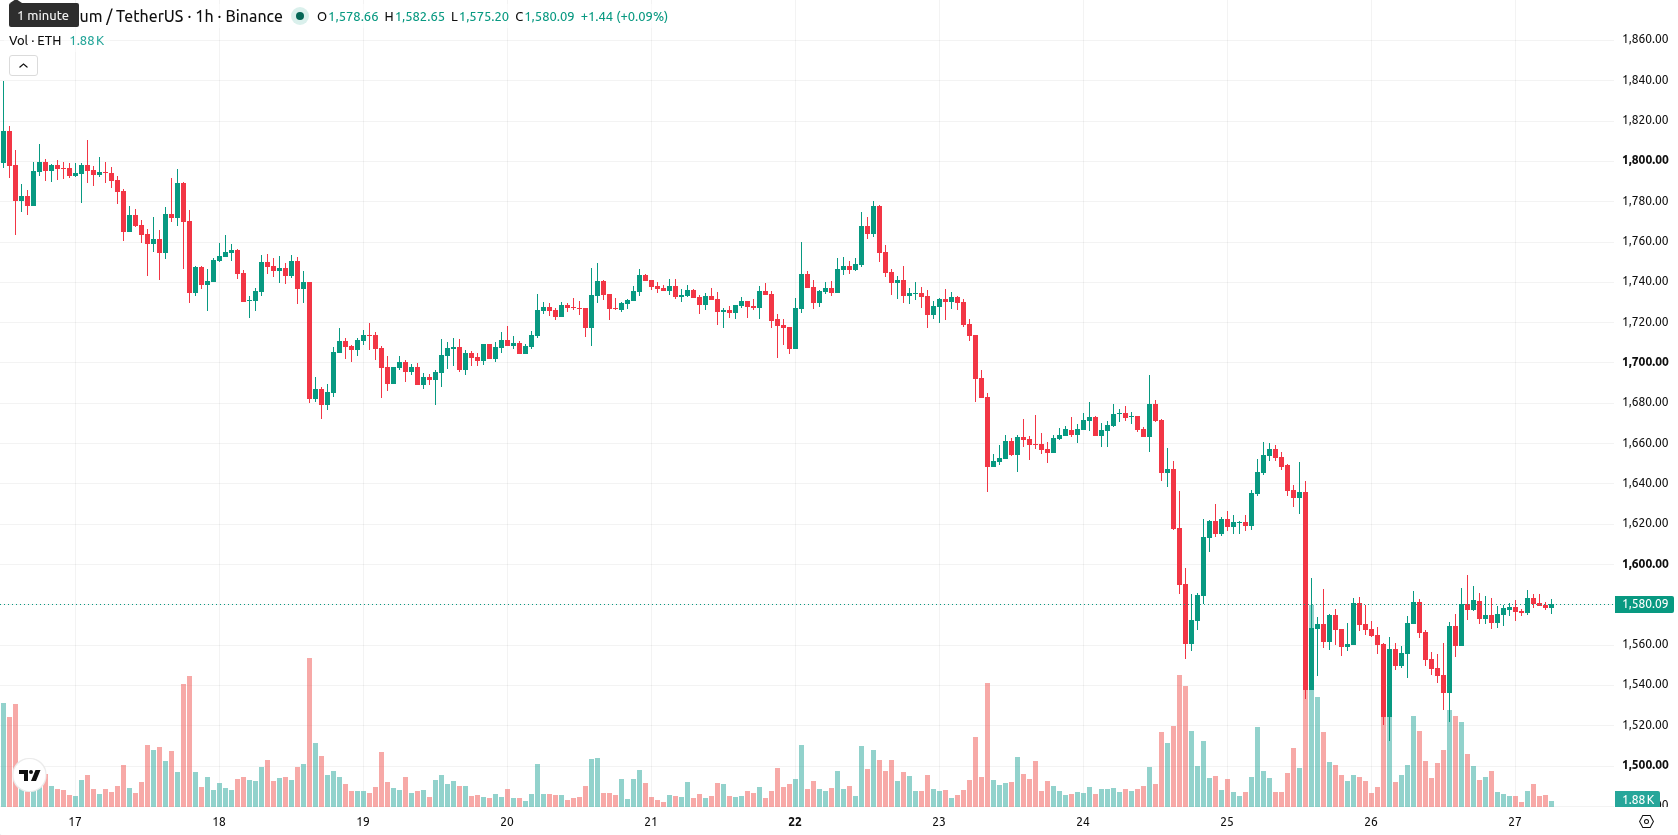
Ethereum (ETH) is trading at $1,578.58, up 1.79% on the day. The price sits above its short-term moving average, though it remains below key medium- and long-term trend markers.
Highlights
- The Ethereum Foundation announced a 20% staff reduction and 40% budget cut, signaling significant cost management amid project uncertainty.
- Spot ETH ETFs saw their largest weekly outflows since January as long-dormant holders liquidated $27.4 million, indicating weakening institutional and long-term confidence.
- ETH/USD faces a likely consolidation between $1,518 and $1,638, with most indicators suggesting weak momentum and a greater probability of further decline.
Long-term holder exits and outflows deepen amid workforce cuts
The Ethereum Foundation’s 20% workforce reduction and 40% budget cut, as reported by Crypto, highlights the organization’s efforts to manage costs amid an uncertain environment, raising questions about future project development pace and network sentiment. The largest weekly outflows from spot ETH ETFs since January and a series of notable sales by long-dormant wallets, including a $27.4 million liquidation tracked by Lookonchain and Arkham and covered by The Block, signal moderating institutional and long-term holder support. Meanwhile, SharpLink’s acquisition of 5,000 ETH, after an extended hiatus, provides a modest signal of renewed treasury accumulation, according to Bitcoinist, but is largely overshadowed by the scale and continuity of recent outflows. Collectively, these events frame a dynamic backdrop for Ethereum, with structural and supply developments influencing day-to-day volatility.
Mixed momentum as key averages and indicators diverge
ETH/USD opened above the 20-day moving average but remains capped by resistance at both the 50-day and 200-day moving averages. The Ichimoku Kijun level at $1,558 acts as immediate support. Technical indicators are mixed: the Moving Average Convergence Divergence (MACD) shows bullish momentum, while the Average Directional Index (ADX) signals weak underlying trend strength. The Relative Strength Index (RSI) and Commodity Channel Index (CCI) both sit in buy territory, but Bull/Bear Power indicates an overbought market, with intraday action dominated by buyers. Stochastic RSI and Awesome Oscillator are neutral, reflecting market uncertainty. Price remains mid-range within the session and volatility is low, highlighting instability as bullish signals are offset by overall trend weakness and overbought intraday conditions.
Downside risk elevated as consolidation dominates outlook
Over the next two to three trading days, ETH/USD is expected to trade within a $1,518–1,638 range. The probability of a further rise is moderate at 37%, while a decline is somewhat more likely at 63%, pointing to a greater chance of further weakness. The baseline scenario is consolidation within this band given current volatility. A close above $1,638 could trigger renewed buying and upward momentum, while a break below $1,518 would likely invite renewed selling pressure and increased downside risk.
Earlier, analysts noted that Ethereum faced persistent pressure from declining ETF inflows and cautious investor sentiment amid a challenging macroeconomic environment. The current analysis adds complexity by highlighting renewed treasury accumulation alongside continued structural outflows, making it essential to watch for a decisive breakout above or below the $1,518–1,638 range to determine Ethereum's next directional shift.


Latest Ethereum News


-
 Afghanistan
-
 Albania
-
 Algeria
-
 Angola
-
 Argentina
-
 Armenia
-
 Australia
-
 Austria
-
 Azerbaijan
-
 Bahamas
-
 Bahrain
-
 Bangladesh
-
 Belarus
-
 Belgium
-
 Bolivia
-
 Botswana
-
 Brazil
-
 Brunei
-
 Bulgaria
-
 Cambodia
-
 Cameroon
-
 Canada
-
 Chile
Chile
-
 China
China
-
 Colombia
-
 Congo
Congo
-
 Costa Rica
-
 Cote d'Ivoire
-
 Croatia
-
 Cuba
Cuba
-
 Cyprus
-
 Czechia
-
 DR Congo
-
 Denmark
-
 Dominican Republic
-
 Ecuador
-
 Egypt
Egypt
-
 El Salvador
-
 Estonia
-
 Eswatini
-
 Ethiopia
-
 Finland
-
 France
-
 Georgia
-
 Germany
-
 Ghana
Ghana
-
 Greece
-
 Haiti
Haiti
-
 Hong Kong
-
 Hungary
-
 India
India
-
 Indonesia
-
 Iran, Islamic republic
-
 Iraq
Iraq
-
 Ireland
-
 Israel
-
 Italy
Italy
-
 Jamaica
-
 Japan
Japan
-
 Jordan
-
 Kazakhstan
-
 Kenya
Kenya
-
 Korea
Korea
-
 Kuwait
-
 Kyrgyzstan
-
 Laos
Laos
-
 Latvia
-
 Lebanon
-
 Lesotho
-
 Libya
Libya
-
 Lithuania
-
 Luxembourg
-
 Madagascar
-
 Malaysia
-
 Malta
Malta
-
 Mauritius
-
 Mexico
-
 Moldova
-
 Mongolia
-
 Montenegro
-
 Morocco
-
 Mozambique
-
 Myanmar
-
 Namibia
-
 Nepal
Nepal
-
 Netherlands
-
 New Zealand
-
 Nigeria
-
 North Macedonia
-
 Norway
-
 Oman
Oman
-
 Pakistan
-
 Palestine
-
 Panama
-
 Papua New Guinea
-
 Paraguay
-
 Peru
Peru
-
 Philippines
-
 Poland
-
 Portugal
-
 Puerto Rico
-
 Qatar
Qatar
-
 Reunion
-
 Romania
-
 Rwanda
-
 Saudi Arabia
-
 Serbia
-
 Singapore
-
 Slovakia
-
 Slovenia
-
 Somalia
-
 South Africa
-
 Spain
Spain
-
 Sri Lanka
-
 Sweden
-
 Switzerland
-
 Syria
Syria
-
 Taiwan
-
 Tajikistan
-
 Tanzania
-
 Thailand
-
 Trinidad and Tobago
-
 Tunisia
-
 Turkey
-
 UAE
UAE
-
 Uganda
-
 Ukraine
-
 United Kingdom
-
United States
-
 Uruguay
-
 Uzbekistan
-
 Venezuela
-
 Vietnam
-
 Yemen
Yemen
-
 Zambia
-
 Zimbabwe
- Forex
- Crypto
