
U.S. spot Ethereum ETF outflows limit Ethereum move

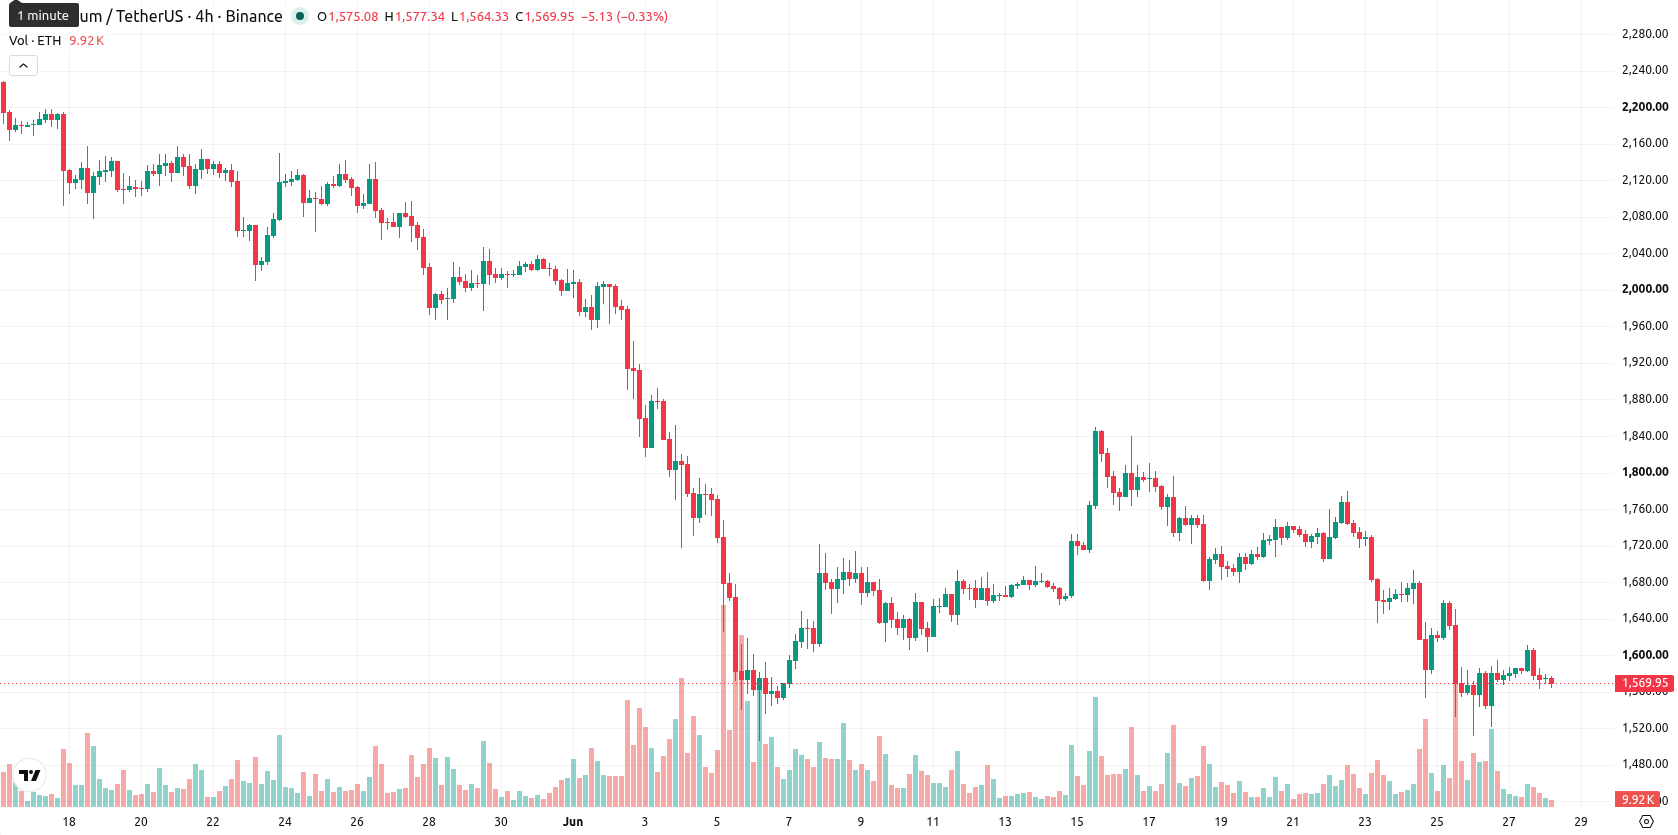
Ethereum (ETH) is trading at $1,569, marking a modest decline for the day and positioning itself below its key short- and medium-term moving averages.
Highlights
- U.S. spot Ethereum ETFs experienced $12.8 million in net outflows on June 26, 2026, marking a seventh straight day of withdrawals and signaling reduced institutional participation.
- Ongoing macroeconomic uncertainty, persistent U.S. inflation at 4.2%, and regulatory pressures continue to restrain investor risk appetite for Ethereum.
- ETH/USD trades below major moving averages with bearish momentum, projecting a high probability of continued downside within a $1,400 to $1,689 range.
Institutional outflows escalate as macro risks and regulation weigh on sentiment
U.S. spot Ethereum ETFs saw net outflows of $12.8 million on June 26, 2026, marking a seventh consecutive day of redemptions and underscoring reduced institutional engagement in the asset, according to Farside Investors and cited by Bitget. This withdrawal of capital may reflect a combination of persistent macroeconomic uncertainty and ongoing regulatory concerns, both weighing on investor sentiment and risk appetite as noted by Bitget. Adding to the cautious environment, U.S. inflation climbed to 4.2% in May 2026, fueling expectations of prolonged monetary tightening and further dampening demand for Ethereum and other risk-oriented assets as reported by Dimsumdaily.
Momentum stays bearish as ETH fails to reclaim technical thresholds
On the 4-hour chart, ETH/USD is trading below both the 20-period and 50-period moving averages, and also remains under the 200-period moving average on the daily timeframe. The Ichimoku Kijun sits at $1,602, acting as immediate resistance. Among momentum indicators, the Moving Average Convergence Divergence (MACD) prints a strong sell signal, while the Average Directional Index (ADX) confirms ongoing downward momentum. The Relative Strength Index (RSI) reads at 41.57, suggesting mild bearishness, whereas the Stochastic RSI and Commodity Channel Index (CCI) provide neutral signals. Bull/Bear Power is oversold, signaling intraday seller dominance, while the Awesome Oscillator is currently neutral. The spot price remains close to the session’s low, with volatility subdued and no short-term oscillator divergence overriding prevailing weakness.
Downtrend continuation risk rises as breakout prospects diminish
Looking ahead over the next several days, Ethereum is likely to consolidate within a typical volatility range of $1,400 to $1,689. The probability of an upward move is considered very low, while a downtrend continuation is highly probable. Should price break above the $1,602 resistance, a test of the upper boundary of the short-term corridor may occur. Conversely, a decline below $1,400 could quickly accelerate recent downside momentum.
Earlier, analysts noted that Ethereum was under pressure from sustained outflows, waning institutional support, and a challenging macroeconomic backdrop, leading to a bias toward further weakness. The current analysis reinforces this outlook with renewed outflows and persistent bearish momentum, highlighting $1,400 as a pivotal level traders should monitor for potential acceleration of downside risk.


Latest Ethereum News


-
 Afghanistan
-
 Albania
-
 Algeria
-
 Angola
-
 Argentina
-
 Armenia
-
 Australia
-
 Austria
-
 Azerbaijan
-
 Bahamas
-
 Bahrain
-
 Bangladesh
-
 Belarus
-
 Belgium
-
 Bolivia
-
 Botswana
-
 Brazil
-
 Brunei
-
 Bulgaria
-
 Cambodia
-
 Cameroon
-
 Canada
-
 Chile
Chile
-
 China
China
-
 Colombia
-
 Congo
Congo
-
 Costa Rica
-
 Cote d'Ivoire
-
 Croatia
-
 Cuba
Cuba
-
 Cyprus
-
 Czechia
-
 DR Congo
-
 Denmark
-
 Dominican Republic
-
 Ecuador
-
 Egypt
Egypt
-
 El Salvador
-
 Estonia
-
 Eswatini
-
 Ethiopia
-
 Finland
-
 France
-
 Georgia
-
 Germany
-
 Ghana
Ghana
-
 Greece
-
 Haiti
Haiti
-
 Hong Kong
-
 Hungary
-
 India
India
-
 Indonesia
-
 Iran, Islamic republic
-
 Iraq
Iraq
-
 Ireland
-
 Israel
-
 Italy
Italy
-
 Jamaica
-
 Japan
Japan
-
 Jordan
-
 Kazakhstan
-
 Kenya
Kenya
-
 Korea
Korea
-
 Kuwait
-
 Kyrgyzstan
-
 Laos
Laos
-
 Latvia
-
 Lebanon
-
 Lesotho
-
 Libya
Libya
-
 Lithuania
-
 Luxembourg
-
 Madagascar
-
 Malaysia
-
 Malta
Malta
-
 Mauritius
-
 Mexico
-
 Moldova
-
 Mongolia
-
 Montenegro
-
 Morocco
-
 Mozambique
-
 Myanmar
-
 Namibia
-
 Nepal
Nepal
-
 Netherlands
-
 New Zealand
-
 Nigeria
-
 North Macedonia
-
 Norway
-
 Oman
Oman
-
 Pakistan
-
 Palestine
-
 Panama
-
 Papua New Guinea
-
 Paraguay
-
 Peru
Peru
-
 Philippines
-
 Poland
-
 Portugal
-
 Puerto Rico
-
 Qatar
Qatar
-
 Reunion
-
 Romania
-
 Rwanda
-
 Saudi Arabia
-
 Serbia
-
 Singapore
-
 Slovakia
-
 Slovenia
-
 Somalia
-
 South Africa
-
 Spain
Spain
-
 Sri Lanka
-
 Sweden
-
 Switzerland
-
 Syria
Syria
-
 Taiwan
-
 Tajikistan
-
 Tanzania
-
 Thailand
-
 Trinidad and Tobago
-
 Tunisia
-
 Turkey
-
 UAE
UAE
-
 Uganda
-
 Ukraine
-
 United Kingdom
-
United States
-
 Uruguay
-
 Uzbekistan
-
 Venezuela
-
 Vietnam
-
 Yemen
Yemen
-
 Zambia
-
 Zimbabwe
- Forex
- Crypto
