
Uniswap slides 3% as price stalls below $3.21 resistance: weekly analysis

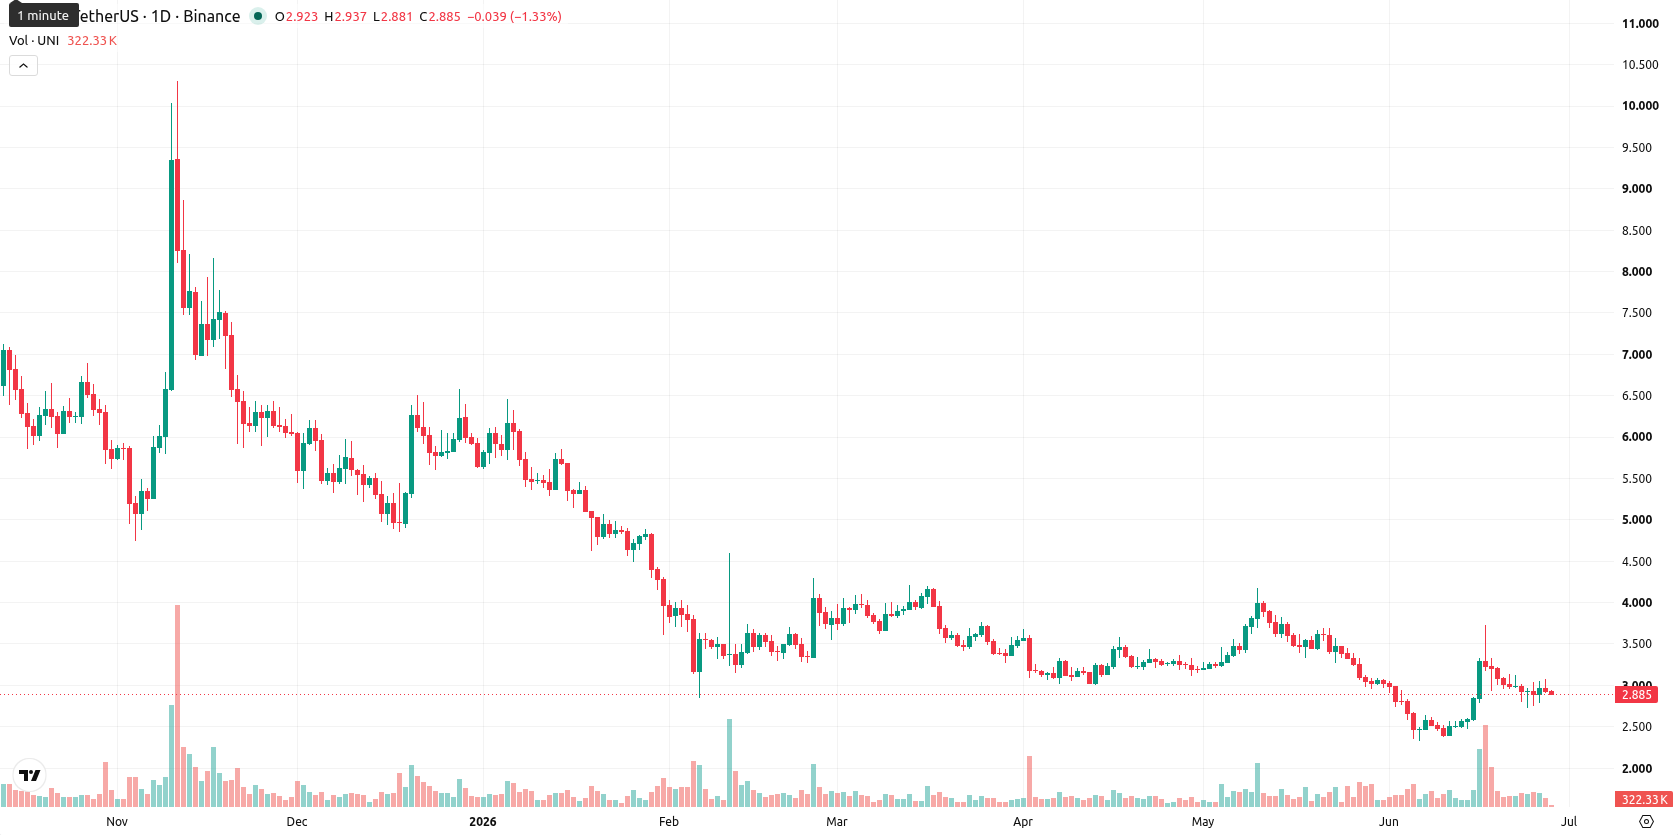
Uniswap (UNI) is trading at $2.886, which is well below its weekly MA-20 of $3.3073, MA-50 of $5.7180, and MA-200 of $6.8585. During the past week, the asset fell $0.091 or 3.02%, consolidating in the middle of its weekly range while remaining under significant pressure from sellers, as indicated by its position relative to the moving averages.
Highlights
- UNI trades firmly below key technical resistance levels, confirming persistent selling pressure and lack of bullish momentum.
- All major momentum and trend indicators signal a continued bearish bias with little evidence of imminent reversal.
- Expected 7-day trading range is $2.71–$3.21, with downside risk dominating and a bullish breakout seen as unlikely.
Bearish bias persists as sell signals dominate weekly indicators
Weekly technical signals confirm persistent bearish momentum for UNI. The MACD on the weekly chart issues a strong sell signal, while the ADX remains neutral, indicating weak directional conviction. Major oscillators such as the RSI (Sell), Commodity Channel Index (Sell), and Stochastic RSI (Neutral) highlight ongoing weakness and limited buyer engagement, while Bull/Bear Power and the Awesome Oscillator both reinforce a sell bias. UNI trades in the middle of its weekly range, facing continued resistance from the MA-20 at $3.3073.
Sideways outlook prevails as technicals limit recovery prospects
Looking ahead, the anticipated trading range for UNI in the next 7 days is $2.71 to $3.21, with weekly volatility at 14.31%. The probability of price recovery is very low, as none of the four major weekly indicators signal a buy. The base scenario is continued sideways movement within the defined corridor. A close above $3.21 could spark a short-term bullish shift, while a move below $2.71 would likely accelerate downside momentum.
Previously it was reported that Uniswap and Spark launched FX Layer, a unified liquidity network aimed at streamlining stablecoin swaps and preparing the ecosystem for significant expansion. While this development positions Uniswap for potential growth as stablecoin infrastructure evolves, technical indicators currently suggest continued sideways movement for UNI, with $2.71 and $3.21 serving as key levels to monitor for potential breakout or breakdown in the coming week.


-
 Afghanistan
-
 Albania
-
 Algeria
-
 Angola
-
 Argentina
-
 Armenia
-
 Australia
-
 Austria
-
 Azerbaijan
-
 Bahamas
-
 Bahrain
-
 Bangladesh
-
 Belarus
-
 Belgium
-
 Bolivia
-
 Botswana
-
 Brazil
-
 Brunei
-
 Bulgaria
-
 Cambodia
-
 Cameroon
-
 Canada
-
 Chile
Chile
-
 China
China
-
 Colombia
-
 Congo
Congo
-
 Costa Rica
-
 Cote d'Ivoire
-
 Croatia
-
 Cuba
Cuba
-
 Cyprus
-
 Czechia
-
 DR Congo
-
 Denmark
-
 Dominican Republic
-
 Ecuador
-
 Egypt
Egypt
-
 El Salvador
-
 Estonia
-
 Eswatini
-
 Ethiopia
-
 Finland
-
 France
-
 Georgia
-
 Germany
-
 Ghana
Ghana
-
 Greece
-
 Haiti
Haiti
-
 Hong Kong
-
 Hungary
-
 India
India
-
 Indonesia
-
 Iran, Islamic republic
-
 Iraq
Iraq
-
 Ireland
-
 Israel
-
 Italy
Italy
-
 Jamaica
-
 Japan
Japan
-
 Jordan
-
 Kazakhstan
-
 Kenya
Kenya
-
 Korea
Korea
-
 Kuwait
-
 Kyrgyzstan
-
 Laos
Laos
-
 Latvia
-
 Lebanon
-
 Lesotho
-
 Libya
Libya
-
 Lithuania
-
 Luxembourg
-
 Madagascar
-
 Malaysia
-
 Malta
Malta
-
 Mauritius
-
 Mexico
-
 Moldova
-
 Mongolia
-
 Montenegro
-
 Morocco
-
 Mozambique
-
 Myanmar
-
 Namibia
-
 Nepal
Nepal
-
 Netherlands
-
 New Zealand
-
 Nigeria
-
 North Macedonia
-
 Norway
-
 Oman
Oman
-
 Pakistan
-
 Palestine
-
 Panama
-
 Papua New Guinea
-
 Paraguay
-
 Peru
Peru
-
 Philippines
-
 Poland
-
 Portugal
-
 Puerto Rico
-
 Qatar
Qatar
-
 Reunion
-
 Romania
-
 Rwanda
-
 Saudi Arabia
-
 Serbia
-
 Singapore
-
 Slovakia
-
 Slovenia
-
 Somalia
-
 South Africa
-
 Spain
Spain
-
 Sri Lanka
-
 Sweden
-
 Switzerland
-
 Syria
Syria
-
 Taiwan
-
 Tajikistan
-
 Tanzania
-
 Thailand
-
 Trinidad and Tobago
-
 Tunisia
-
 Turkey
-
 UAE
UAE
-
 Uganda
-
 Ukraine
-
 United Kingdom
-
United States
-
 Uruguay
-
 Uzbekistan
-
 Venezuela
-
 Vietnam
-
 Yemen
Yemen
-
 Zambia
-
 Zimbabwe
- Forex
- Crypto
