
Uptrend stalling at resistance caps Rocket Pool advance

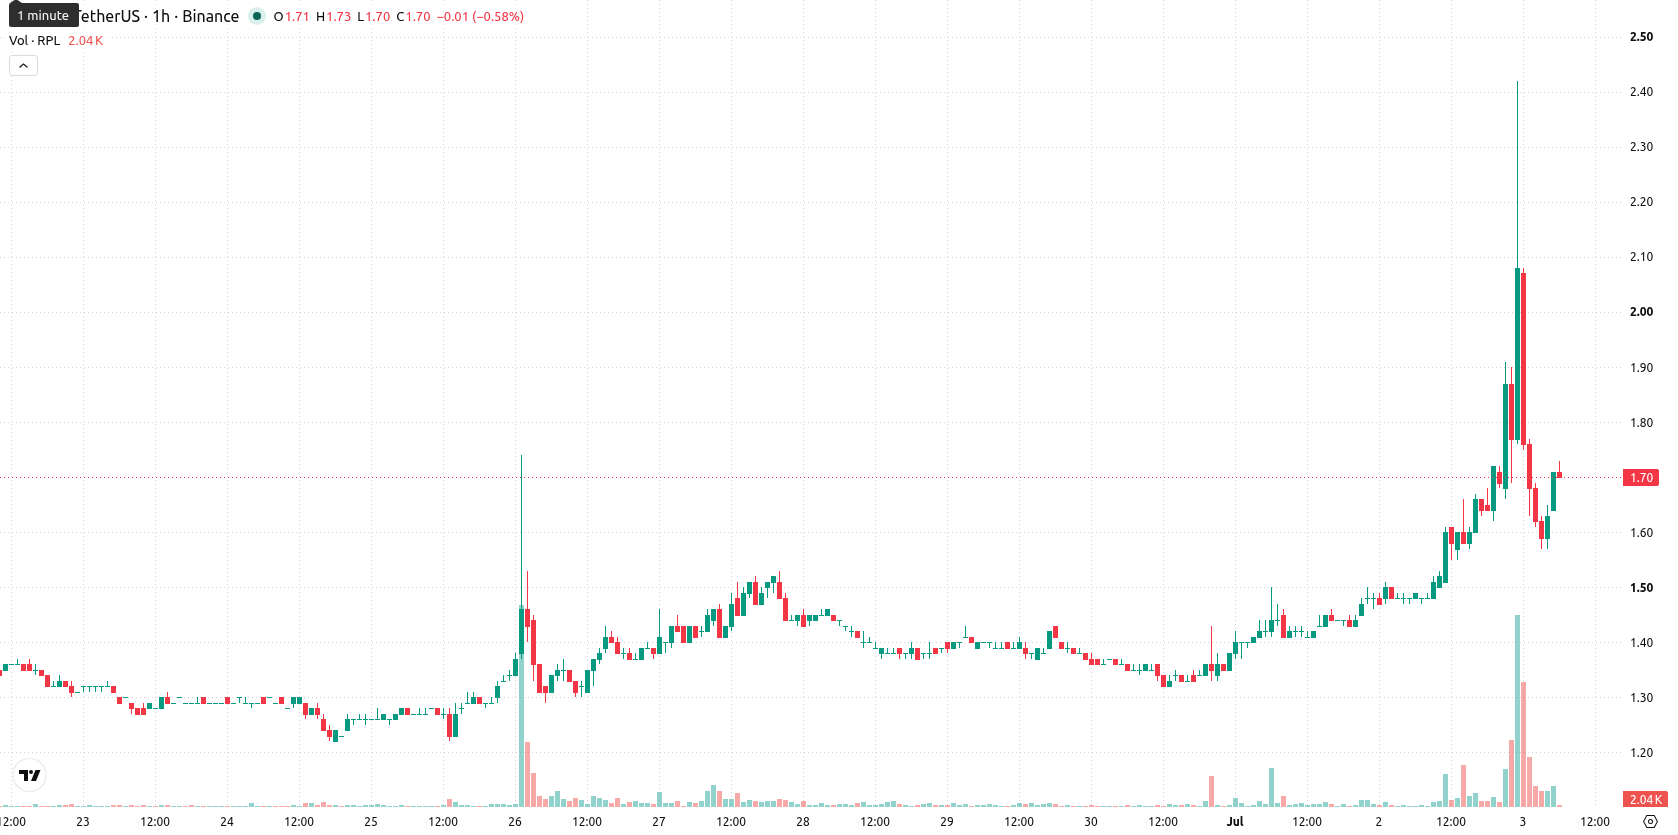
Rocket Pool (RPL) is trading at $1.71, posting a 15.54% daily gain. The price is above its key moving averages, reflecting a strong recovery from recent lows.
Highlights
- RPL/USD shows short- and medium-term strength but remains unable to reclaim long-term bullish status below major resistance.
- Despite a 15.54% surge to $1.71, mixed oscillator signals highlight possible near-term exhaustion and persistent high volatility.
- Price is likely to consolidate within the $1.464–$1.956 range; breakout above $1.945 signals bullish continuation, while loss of $1.464 support turns outlook bearish.
Bullish momentum faces mixed signals at critical technical thresholds
The nearest technical resistance for RPL is at the Ichimoku Kijun level of $1.945, while support stands at $1.464. On the hourly chart, the Moving Average Convergence Divergence (MACD) and Average Directional Index (ADX) indicate strong bullish momentum. The Relative Strength Index (RSI) is neutral at 49 with a Sell signal, the Stochastic RSI is Oversold, and the Commodity Channel Index (CCI) is Neutral. Bull/Bear Power indicates sellers currently dominate, and the Awesome Oscillator is neutral, providing no clear conviction. The presence of both strong bullish momentum and divergent oscillator signals suggests a potential for near-term exhaustion despite recent upward movement.
Sideways trading likely as volatility limits breakout prospects
Over the next 2 to 3 trading days, RPL is expected to fluctuate within the $1.464 to $1.956 range, reflecting typical volatility relative to current levels. The probability of an upward move is estimated at 64%, compared to a 36% chance of decline. The base case envisions sideways trading contained between key levels. A bullish scenario materializes if price breaks above the $1.945 resistance, while a bearish outcome may develop with a sustained drop below $1.464 support.
Earlier, analysts noted that Rocket Pool was demonstrating short-term bullish momentum supported by technical indicators, despite lingering long-term risks. The current surge above key moving averages, coupled with conflicting momentum signals, underscores the importance of monitoring the $1.945 resistance for a potential breakout or signs of bullish exhaustion in the near term.


Latest RPL News


-
 Afghanistan
-
 Albania
-
 Algeria
-
 Angola
-
 Argentina
-
 Armenia
-
 Australia
-
 Austria
-
 Azerbaijan
-
 Bahamas
-
 Bahrain
-
 Bangladesh
-
 Belarus
-
 Belgium
-
 Bolivia
-
 Botswana
-
 Brazil
-
 Brunei
-
 Bulgaria
-
 Cambodia
-
 Cameroon
-
 Canada
-
 Chile
Chile
-
 China
China
-
 Colombia
-
 Congo
Congo
-
 Costa Rica
-
 Cote d'Ivoire
-
 Croatia
-
 Cuba
Cuba
-
 Cyprus
-
 Czechia
-
 DR Congo
-
 Denmark
-
 Dominican Republic
-
 Ecuador
-
 Egypt
Egypt
-
 El Salvador
-
 Estonia
-
 Eswatini
-
 Ethiopia
-
 Finland
-
 France
-
 Georgia
-
 Germany
-
 Ghana
Ghana
-
 Greece
-
 Haiti
Haiti
-
 Hong Kong
-
 Hungary
-
 India
India
-
 Indonesia
-
 Iran, Islamic republic
-
 Iraq
Iraq
-
 Ireland
-
 Israel
-
 Italy
Italy
-
 Jamaica
-
 Japan
Japan
-
 Jordan
-
 Kazakhstan
-
 Kenya
Kenya
-
 Korea
Korea
-
 Kuwait
-
 Kyrgyzstan
-
 Laos
Laos
-
 Latvia
-
 Lebanon
-
 Lesotho
-
 Libya
Libya
-
 Lithuania
-
 Luxembourg
-
 Madagascar
-
 Malaysia
-
 Malta
Malta
-
 Mauritius
-
 Mexico
-
 Moldova
-
 Mongolia
-
 Montenegro
-
 Morocco
-
 Mozambique
-
 Myanmar
-
 Namibia
-
 Nepal
Nepal
-
 Netherlands
-
 New Zealand
-
 Nigeria
-
 North Macedonia
-
 Norway
-
 Oman
Oman
-
 Pakistan
-
 Palestine
-
 Panama
-
 Papua New Guinea
-
 Paraguay
-
 Peru
Peru
-
 Philippines
-
 Poland
-
 Portugal
-
 Puerto Rico
-
 Qatar
Qatar
-
 Reunion
-
 Romania
-
 Rwanda
-
 Saudi Arabia
-
 Serbia
-
 Singapore
-
 Slovakia
-
 Slovenia
-
 Somalia
-
 South Africa
-
 Spain
Spain
-
 Sri Lanka
-
 Sweden
-
 Switzerland
-
 Syria
Syria
-
 Taiwan
-
 Tajikistan
-
 Tanzania
-
 Thailand
-
 Trinidad and Tobago
-
 Tunisia
-
 Turkey
-
 UAE
UAE
-
 Uganda
-
 Ukraine
-
 United Kingdom
-
United States
-
 Uruguay
-
 Uzbekistan
-
 Venezuela
-
 Vietnam
-
 Yemen
Yemen
-
 Zambia
-
 Zimbabwe
- Forex
- Crypto
