

Maple drops more than 8% after trading well below long-term average

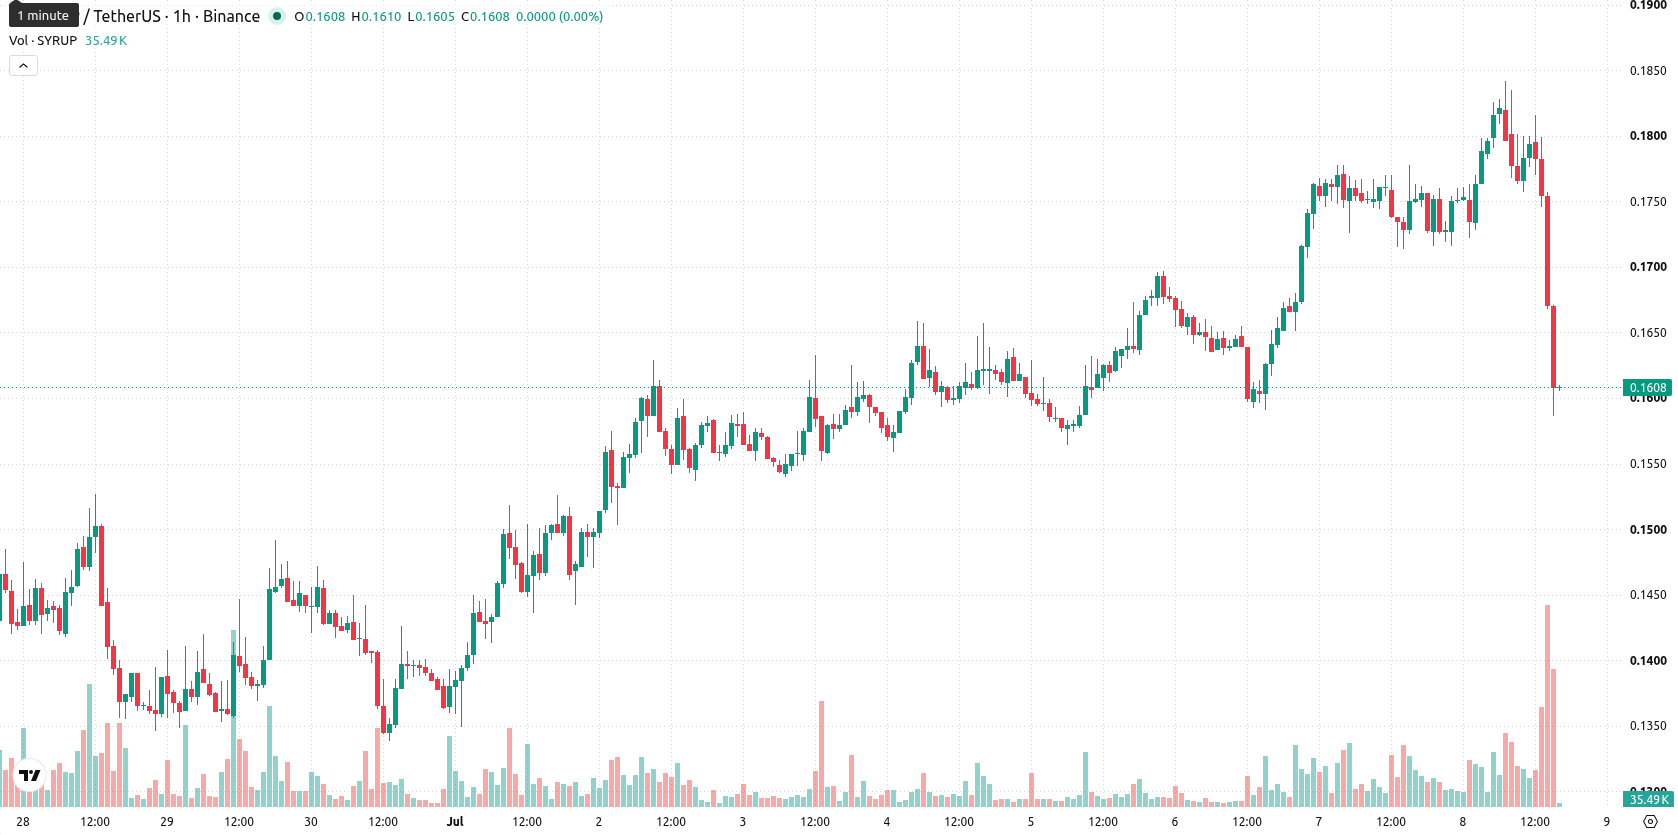
Maple (SYRUP) is trading at $0.1607, marking a daily decline of 8.17%. The asset remains below its key moving averages, signaling ongoing negative momentum relative to recent price trends.
 0.2352
0.2706
0.2352
0.2706
Highlights
- SYRUP/USD remains below key short-, medium-, and long-term moving averages, signaling persistent downward momentum across all timeframes.
- Oscillator readings show strong oversold signals, but neutral trend indicators suggest short-term exhaustion without clear signs of reversal.
- Expected range for the next 2–3 days is $0.1543–$0.1847, with a 65% probability of further downside unless price reclaims immediate resistance.
Oversold signals emerge as neutral momentum meets resistance
On the hourly chart, SYRUP/USD is trading below the 20-period moving average at $0.1765 and the 50-period moving average at $0.1739. The daily chart shows the price well beneath the 200-period moving average at $0.242, and immediate resistance is presented by the Ichimoku Kijun at $0.1757. The Relative Strength Index (RSI) stands at 33.39, pointing to a sell bias. The Moving Average Convergence Divergence (MACD) and Average Directional Index (ADX) provide neutral signals, while the Stochastic RSI and Commodity Channel Index (CCI) both indicate oversold conditions. Bull/Bear Power suggests sellers are dominant intraday, as volatility remains high and price sits near today's low. The discrepancies between neutral trend indicators and strong oversold oscillator readings highlight short-term exhaustion but lack clear evidence of an imminent reversal.
Downside risk prevails as range narrows and sentiment weakens
Over the next 2–3 trading days, SYRUP is expected to fluctuate between $0.1543 and $0.1847, reflecting typical volatility relative to current levels. Downside probability is calculated at 65%, with upside at 35%, indicating a higher likelihood of continued weakness barring a swift sentiment shift. The baseline scenario assumes sideways movement within the range. A move above $0.1757 would signal a break of resistance, while a decisive drop below $0.1543 would point to further declines.
Earlier, analysts noted that Maple was demonstrating bullish momentum supported by strong technical foundations and investor interest. The current downside break and oversold technical readings signal a reversal in sentiment, putting focus on whether the asset can recover above resistance at $0.1757 to negate further weakness.










-
 Afghanistan
-
 Albania
-
 Algeria
-
 Angola
-
 Argentina
-
 Armenia
-
 Australia
-
 Austria
-
 Azerbaijan
-
 Bahamas
-
 Bahrain
-
 Bangladesh
-
 Belarus
-
 Belgium
-
 Bolivia
-
 Botswana
-
 Brazil
-
 Brunei
-
 Bulgaria
-
 Cambodia
-
 Cameroon
-
 Canada
-
 Chile
Chile
-
 China
China
-
 Colombia
-
 Congo
Congo
-
 Costa Rica
-
 Cote d'Ivoire
-
 Croatia
-
 Cuba
Cuba
-
 Cyprus
-
 Czechia
-
 DR Congo
-
 Denmark
-
 Dominican Republic
-
 Ecuador
-
 Egypt
Egypt
-
 El Salvador
-
 Estonia
-
 Eswatini
-
 Ethiopia
-
 Finland
-
 France
-
 Georgia
-
 Germany
-
 Ghana
Ghana
-
 Greece
-
 Haiti
Haiti
-
 Hong Kong
-
 Hungary
-
 India
India
-
 Indonesia
-
 Iran, Islamic republic
-
 Iraq
Iraq
-
 Ireland
-
 Israel
-
 Italy
Italy
-
 Jamaica
-
 Japan
Japan
-
 Jordan
-
 Kazakhstan
-
 Kenya
Kenya
-
 Korea
Korea
-
 Kuwait
-
 Kyrgyzstan
-
 Laos
Laos
-
 Latvia
-
 Lebanon
-
 Lesotho
-
 Libya
Libya
-
 Lithuania
-
 Luxembourg
-
 Madagascar
-
 Malaysia
-
 Malta
Malta
-
 Mauritius
-
 Mexico
-
 Moldova
-
 Mongolia
-
 Montenegro
-
 Morocco
-
 Mozambique
-
 Myanmar
-
 Namibia
-
 Nepal
Nepal
-
 Netherlands
-
 New Zealand
-
 Nigeria
-
 North Macedonia
-
 Norway
-
 Oman
Oman
-
 Pakistan
-
 Palestine
-
 Panama
-
 Papua New Guinea
-
 Paraguay
-
 Peru
Peru
-
 Philippines
-
 Poland
-
 Portugal
-
 Puerto Rico
-
 Qatar
Qatar
-
 Reunion
-
 Romania
-
 Rwanda
-
 Saudi Arabia
-
 Serbia
-
 Singapore
-
 Slovakia
-
 Slovenia
-
 Somalia
-
 South Africa
-
 Spain
Spain
-
 Sri Lanka
-
 Sweden
-
 Switzerland
-
 Syria
Syria
-
 Taiwan
-
 Tajikistan
-
 Tanzania
-
 Thailand
-
 Trinidad and Tobago
-
 Tunisia
-
 Turkey
-
 UAE
UAE
-
 Uganda
-
 Ukraine
-
 United Kingdom
-
United States
-
 Uruguay
-
 Uzbekistan
-
 Venezuela
-
 Vietnam
-
 Yemen
Yemen
-
 Zambia
-
 Zimbabwe
- Forex
- Crypto












